Prometheus II
Alert Manager The prometheus generates alert for you but it cannot send notification to yo via email, slack, teams, etc. So for this we need to configure alert manager. Prometheus allows you to…


ON THIS PAGE
Alert Manager
- The prometheus generates alert for you but it cannot send notification to yo via email, slack, teams, etc. So for this we need to configure alert manager.
- Prometheus allows you to define conditions that if met trigger alerts these conditions are defined as standard PromQL expression
- Prometheus is only responsible for triggering alerts. It doesn’t send notifications such as emails, text messages. That responsibility is offloaded onto a separate process called Alertmanager
- Alerting rules
- Similar to recording rules and can be placed right alongside recording rules within a rule group.
- Basically we configure rules like in which cases what to notice and what to sent alert about. Basically this is done by the alert manager.
- Example:
groups:
  - name: node
    rules:
      - alert: node down
expr: up{job="node"} == 0- For clause
- The for clause tells prometheus that an expression must evaluate to true for a specified period of time before firing alert.
- For example if due to some network latency error if the system goes for example we cannot reach the system for 5 sec due to high latency but it came up after 5 sec. So for these cases normally it will generate the alert.
- So to avoid this situation we can use alert managers.
- In the below example it will only generate alert if the system is down for 5 minutes otherwise it won’t generate alerts.
groups:
  - name: node
    rules:
      - alert: node down
        expr: up{job="node"} == 0
for: 5m- This example expects the node to be down for 5 minutes before firing an alert. Helps prevent race conditions and scrape timeouts, Network issues could cause an individual scrape to fail, it’s best to specify a duration to avoid false alarms. We can see in the alerts tab in prometheus ui
- There are 3 different states.
- Inactive -> Expression has not returned any results
- Pending -> expression returned results but it hasn’t been long enough to be considered
- firing(5m in this case)
- Firing -> Active for more than the defined clause(5m in this case)
PENDING = “I think there’s a problem, but I’m waiting a bit to be sure.”
FIRING = “Yep — it’s definitely a problem now. Notify people.”
INACTIVE = “No problem right now. Nothing to do.”- Labels
- Labels can be added to alerts to provide a mechanism to classify and match specific alerts in Alertmanager
groups:
  - name: node
    rules:
      - alert: node down
        expr: up{job="node"} == 0
        labels:
          severity: warning

      - alert: Multiple nodes down
        expr: avg_without(instance)(up{job="node"}) <= 0.5
        labels:
severity: critical- Annotations
- Annotations can be used to provide additional information, however unlike labels they do not play a part in the alerts identity. So they cannot be use for routing in Alertmanager. Annotations are templated using the Go templating language.
- To access alert labels use {{.Labels}}
- To get instance label use {{.Labels.instance}}
- To get the firing sample value use {{.Value}}
- Annotations can be used to provide additional information, however unlike labels they do not play a part in the alerts identity. So they cannot be use for routing in Alertmanager. Annotations are templated using the Go templating language.
groups:
  - name: node
    rules:
      - alert: node_filesystem_free_percent
        expr: |
          100 * node_filesystem_free_bytes{job="node"} /
          node_filesystem_size_bytes{job="node"} < 70
        annotations:
description: "Filesystem {{ .Labels.device }} on {{ .Labels.instance }} is low on space. Current available space is {{ .Value }}"Alertmanager is responsible for receiving alerts generated from Prometheus and converting them into notifications. These notifications can include, pages, webhooks, email messages, and chat messages
Installation of Alert manager
To install the alert manager you can download the zip file and manually run the alert manager. But i am using script to install alert manager and create service file to manage the alert manager.
alertmanager_install.sh
#!/bin/bash

sudo useradd --no-create-home --shell /bin/false alertmanager
sudo mkdir /etc/alertmanager


wget https://github.com/prometheus/alertmanager/releases/download/v0.28.1/alertmanager-0.28.1.linux-amd64.tar.gz

tar xzf alertmanager-0.28.1.linux-amd64.tar.gz
cd alertmanager-0.28.1.linux-amd64
sudo mv alertmanager.yml /etc/alertmanager
sudo chown -R alertmanager:alertmanager /etc/alertmanager
sudo mkdir /var/lib/alertmanager
sudo chown -R alertmanager:alertmanager /var/lib/alertmanager
sudo cp alertmanager /usr/local/bin
sudo cp amtool /usr/local/bin
sudo chown alertmanager:alertmanager /usr/local/bin/alertmanager
sudo chown alertmanager:alertmanager /usr/local/bin/amtool

# the service will listen on port 9093
cd -
sudo cp alertmanager.service /etc/systemd/system/

sudo systemctl daemon-reload
sudo systemctl start alertmanager
sudo systemctl enable alertmanager
sudo systemctl status alertmanageralertmanager.service
[Unit]
Description=Alert Manager
Wants=network-online.target
After=network-online.target

[Service]
Type=simple
User=alertmanager
Group=alertmanager
ExecStart=/usr/local/bin/alertmanager \
       --config.file=/etc/alertmanager/alertmanager.yml \
       --storage.path=/var/lib/alertmanager

Restart=always

[Install]
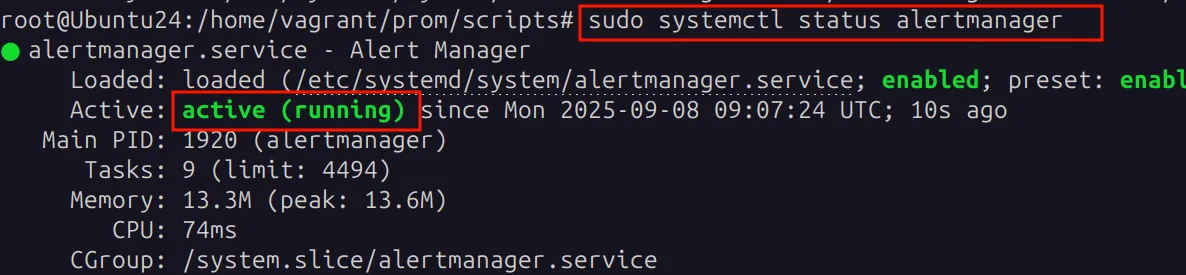
WantedBy=multi-user.targetAfter running the alertmanager_install.sh we can see it is running successfully.
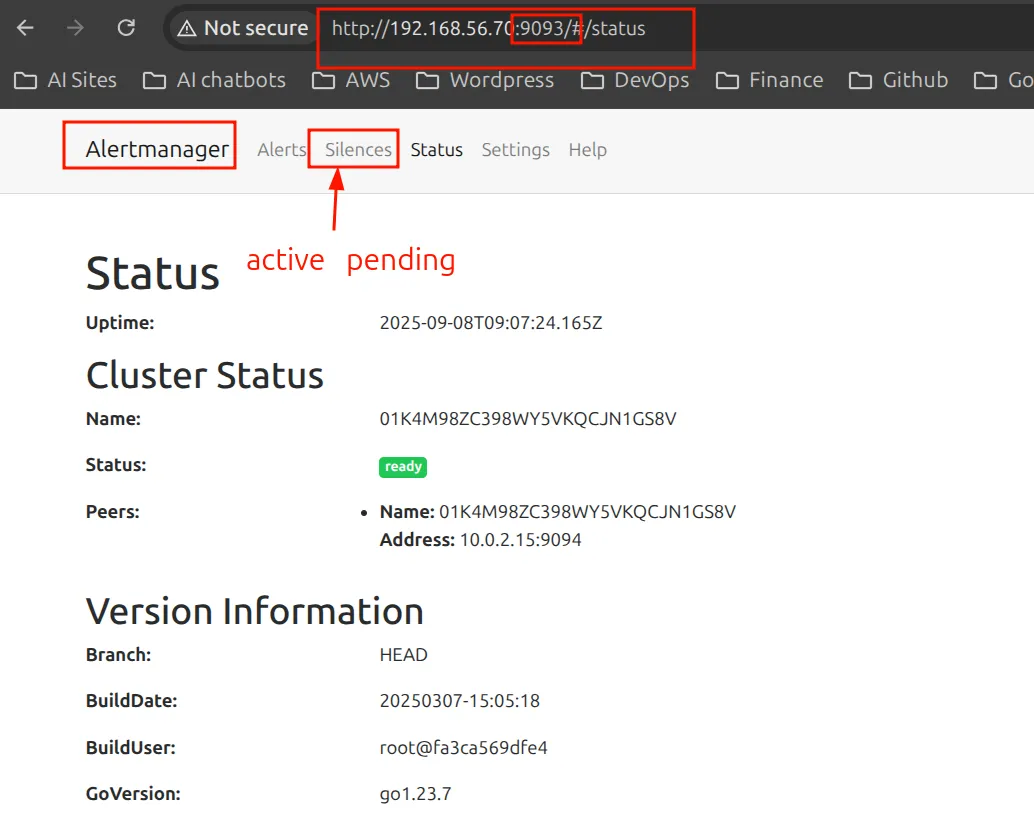
The alertmanager runs at port in 9093 and when you browse in that port you can see alert manager is running successfully.
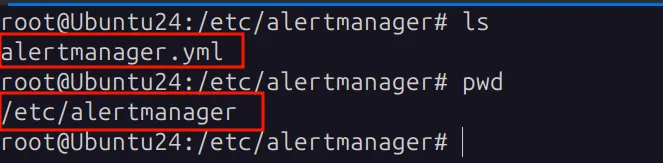
- Now we need to create another file called alertmanager.yml in the path /etc/prometheus but this wrong path that we have done mistake.
- correct path is /etc/alertmanager
alertmanager.yml //default file
# =======================
# Alertmanager config
# =======================

route: # root route
  group_by: ['alertname']       # group alerts by alertname
  group_wait: 30s               # wait before first notification
  group_interval: 5m            # min time between notifications for same group
  repeat_interval: 1h           # resend if still firing
  receiver: 'web.hook'          # default receiver

  routes:                       # sub-routes for specific alerts
    - match_re:                 # regex match on job label
        job: (node|db1|db2)
      group_by: ['team', 'env'] # group by team/env
      receiver: slack           # send to Slack

# =======================
# Receivers
# =======================
receivers:
  - name: 'web.hook'
    webhook_configs:
      - url: 'http://127.0.0.1:5001/' # webhook endpoint

  - name: slack
    slack_configs:
      - api_url: https://hooks.slack.com/services/XXXXXXXXX/XXXXXXXXXXXXXXXXXXX
        channel: '#prometheus-alerts' # Slack channel
        title: '{{ .GroupLabels.team }} has alerts in env: {{ .GroupLabels.env }}'
        text: '{{ range .Alerts }}{{ .Annotations.message }}{{ "\n" }}{{ end }}' # list all messages

# =======================
# Inhibition rules
# =======================
inhibit_rules:
  - source_match:
      severity: 'critical'      # if critical alert fires
    target_match:
      severity: 'warning'       # silence related warnings
equal: ['alertname', 'dev', 'instance'] # only if these labels match- These are the default configurations which we need to modify based on our need. Now let’s configure this file based on our need.
- First let’s create rules then we will redirect alerts to alert manager.
- rules.yml file
groups:
  - name: my-alerts
    interval: 15s   # how often to evaluate rules
    rules:
      - alert: NodeDown              # alert name
        expr: up{job="Node_exporter_next_vm"} == 0
        for: 2m                      # wait 2m before firing
        labels:
          team: infra
          env: dev
        annotations:
          message: "instance {{ .Labels.instance }} is currently down"

      - alert: Docker-engine
        expr: up{job="Docker_engine"} == 0  # match job exactly
        for: 0m                             # fire immediately
        labels:
          team: microservices
          env: prod
        annotations:
          message: "{{ .Labels.instance }} is currently down"

      - alert: Frontend_App_Down
        expr: up{job="cAdvisor"} == 0
        for: 0m
        labels:
          team: Frontend
          env: dev
        annotations:
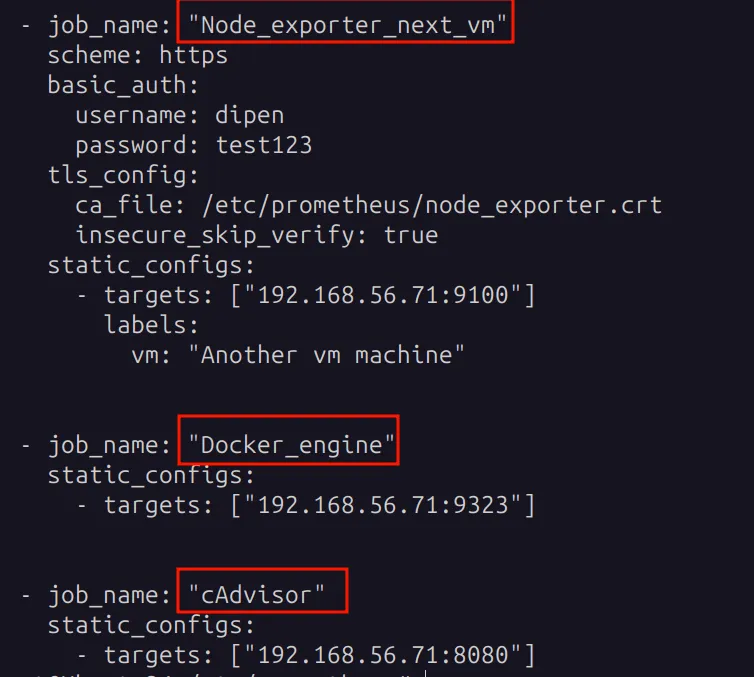
message: "instance {{ .Labels.instance }} is currently down"Here in expr we have taken the job from the prometheus.yml file.ie;
Now we need to add rules in the prometheus.yml file. ie;
global:
  scrape_interval: 15s
  evaluation_interval: 15s

alerting:
  alertmanagers:
    - static_configs:
        - targets:
          # - alertmanager:9093

rule_files:
  - rules.yml

scrape_configs:
  - job_name: "prometheus"

    static_configs:
      - targets: ["localhost:9090"]
        labels:
          app: "prometheus"


  - job_name: "PrometheusVM"
    static_configs:
      #node_exporter machine_ip and node_exporter port
      - targets: ["192.168.56.70:9100"]
        labels:
          app: "Node_exporter_VM"

  - job_name: "Node_exporter_next_vm"
    scheme: https
    basic_auth:
      username: dipen
      password: test123
    tls_config:
      ca_file: /etc/prometheus/node_exporter.crt
      insecure_skip_verify: true
    static_configs:
      - targets: ["192.168.56.71:9100"]
        labels:
          vm: "Another vm machine"


  - job_name: "Docker_engine"
    static_configs:
      - targets: ["192.168.56.71:9323"]


  - job_name: "cAdvisor"
    static_configs:
- targets: ["192.168.56.71:8080"]- NOTE: The rules.yml should be in the same path
- Now restart the prometheus service.
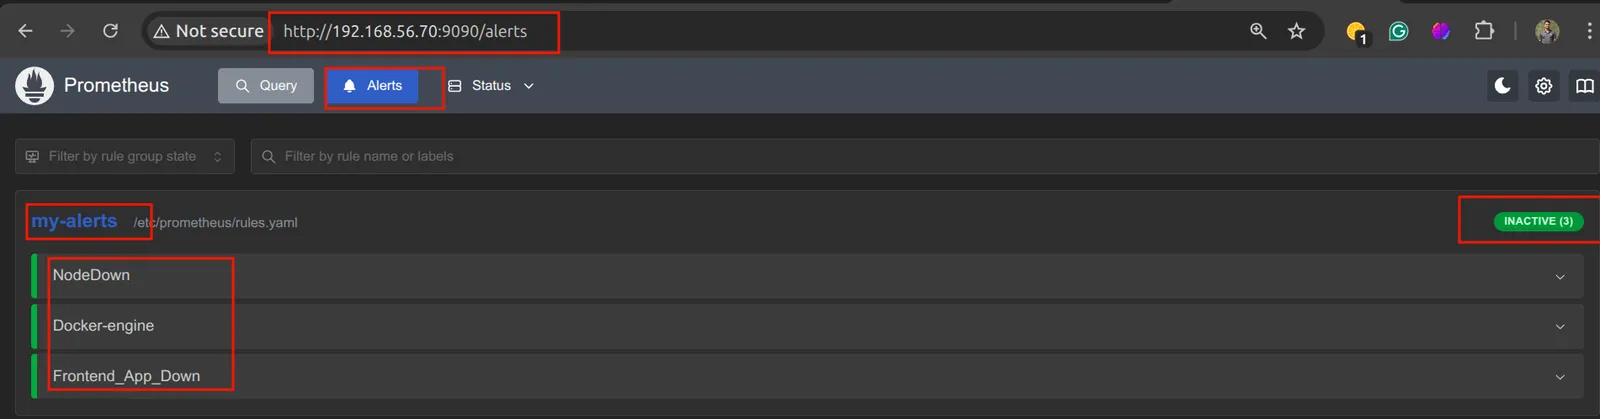
- Here you can see all three services are installed and running . Now let’s stop docker engine and CA advisor.

- Now we will see the status of docker-engine and Frontend app as firing.
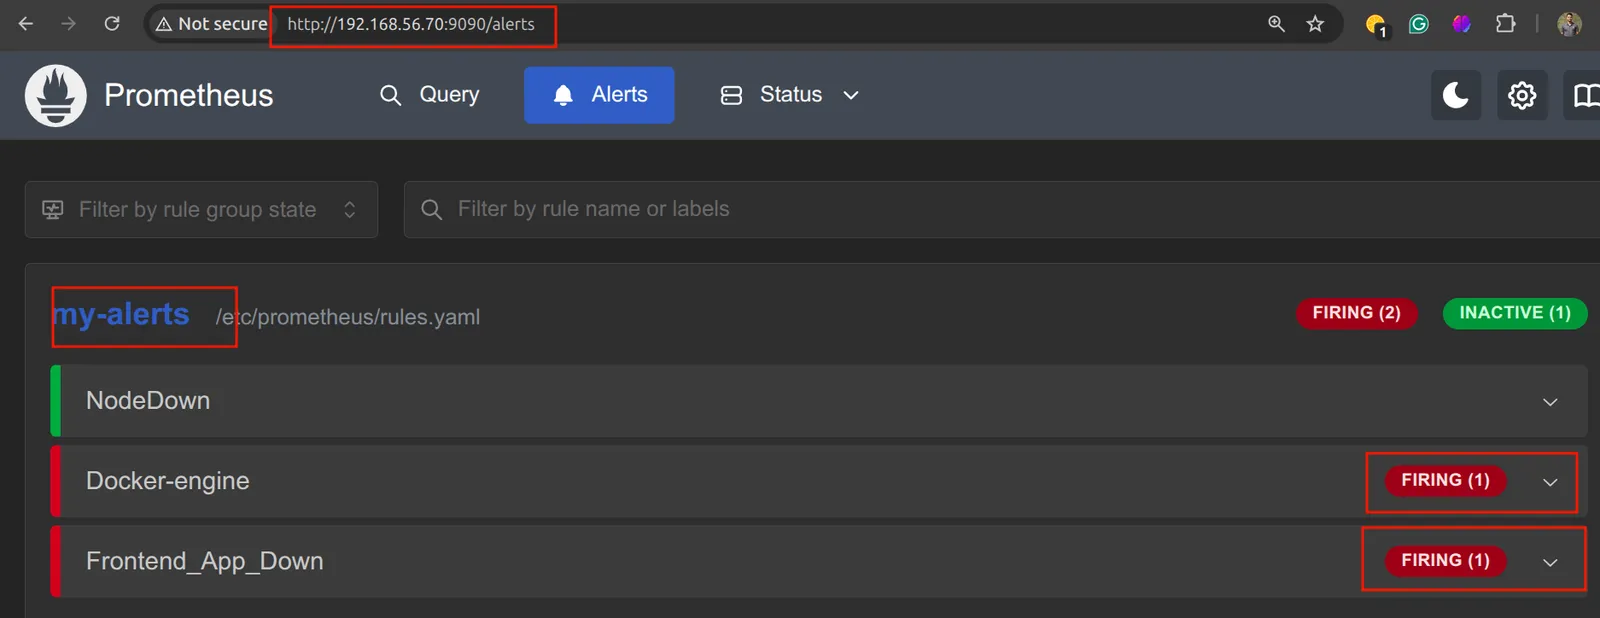
- Here now we can see the docker and cAdvisor both of them are down and it is showing alerts. Now we need to send this to the alertmanager. For this we need to configure alertmanager.yml that we have placed in /etc/alertmanager directory.
route: #configured route
  group_by: ['alertname']
  group_wait: 30s
  group_interval: 5m
  repeat_interval: 1h
  receiver: 'web.hook'  #This is the in web-hook
  routes:
    - match_re:
        job: (Node_exporter_next_vm|Docker_engine|cAdvisor) #Configured Job
      group_by: ['prod', 'dev']  #Here the value of env in defined in rules.yaml file
      receiver: slack
receivers:
  - name: 'web.hook' #To see the alerts in web. ie; ipaddr:9093
    webhook_configs:
      - url: 'http://127.0.0.1:5001/'

inhibit_rules:
  - source_match:
      severity: 'critical'
    target_match:
      severity: 'warning'
equal: ['alertname', 'dev', 'instance']- Here we have only configure for web now. Now let’s configure prometheus.yml file to send the alerts to the alertmanager.
global:
  scrape_interval: 15s
  evaluation_interval: 15s

alerting:
  alertmanagers:
    - static_configs:
        - targets:
            - 192.168.56.70:9093 #Added ip and port of the alert manager
          # - alertmanager:9093

rule_files:
  - rules.yaml
scrape_configs:
  - job_name: "prometheus"

    static_configs:
      - targets: ["localhost:9090"]
        labels:
          app: "prometheus"


  - job_name: "PrometheusVM"
    static_configs:
      #node_exporter machine_ip and node_exporter port
      - targets: ["192.168.56.70:9100"]
        labels:
          app: "Node_exporter_VM"

  - job_name: "Node_exporter_next_vm"
    scheme: https
    basic_auth:
      username: dipen
      password: test123
    tls_config:
      ca_file: /etc/prometheus/node_exporter.crt
      insecure_skip_verify: true
    static_configs:
      - targets: ["192.168.56.71:9100"]
        labels:
          vm: "Another vm machine"


  - job_name: "Docker_engine"
    static_configs:
      - targets: ["192.168.56.71:9323"]


  - job_name: "cAdvisor"
    static_configs:
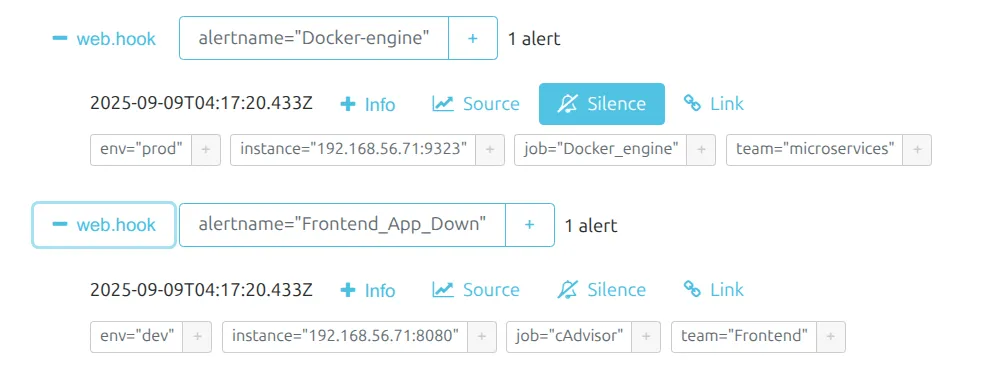
- targets: ["192.168.56.71:8080"]- As our docker engine and cAdvisor is down we can see this alert in alert manager.
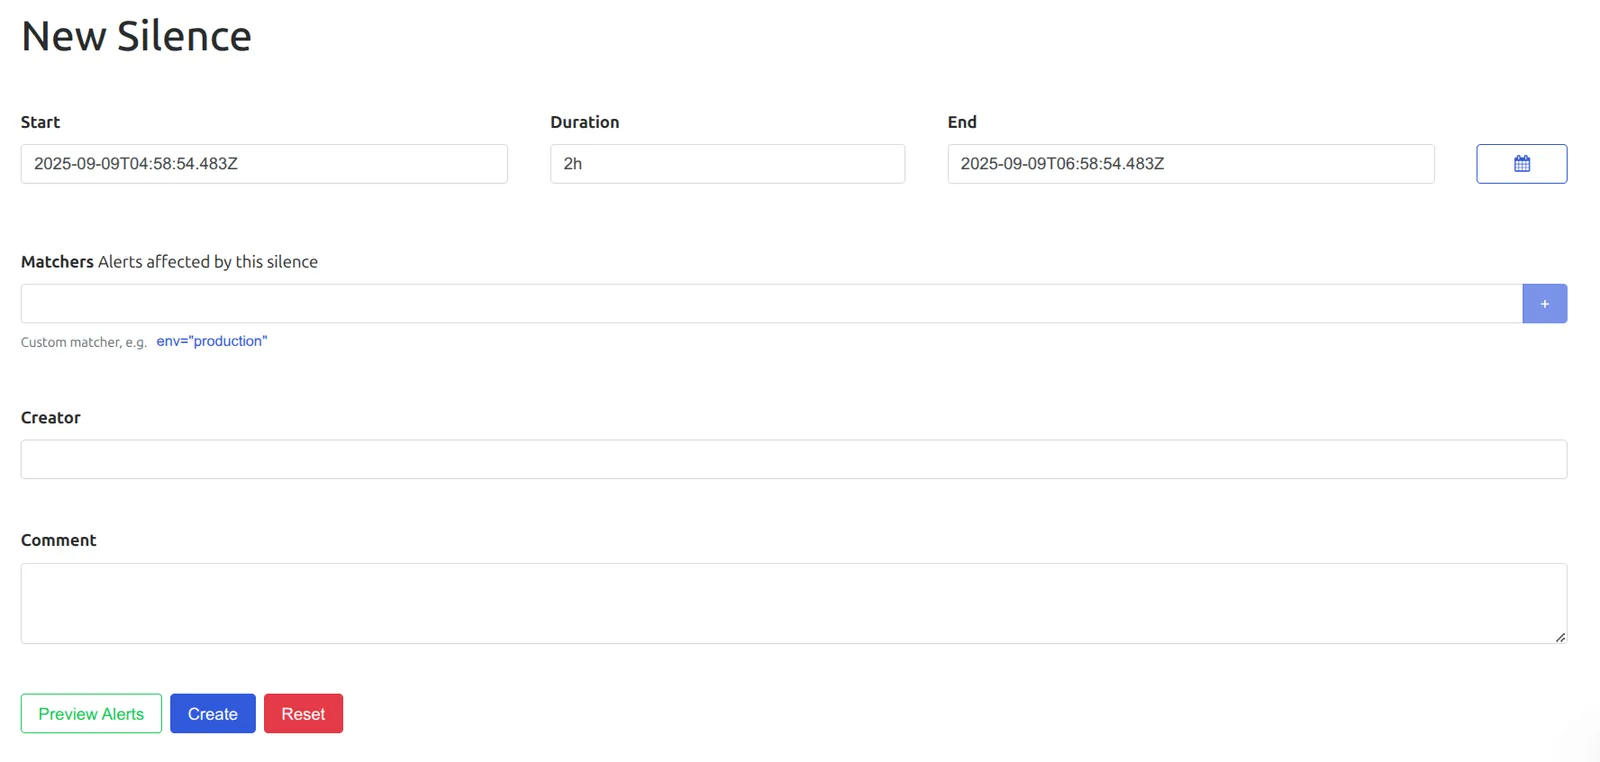
- silence option: To block the unnecessary notification. For example we are upgrading the app and it will take 1 hr minimum. In this case the prometheus will send notifications in certain time frame that we have sent. So to ignore this we can use this silence option. If we have configure slack or any other medium then it will send notificatin and if we use this option
Basic configuration of Alert Manager
global:
  smtp_smarthost: 'mail.example.com:25'
  smtp_from: 'test@examole.com'

route:
  receiver: staff
  group_by: ['alertname', 'job']
  routes:
    - match_re:
        job: (mode|windows)
      receiver: infra-email
    - matchers:
        - job = "kubernetes"
      receiver: k8s-slack

receivers:
  - name: 'k8s-slack'
    slack_configs:
      - channel: '#alerts'
text: 'https://example.com/alerts/{{.GroupLabels.app}}/'Three main sections in alertmanager.yml
- Global section: applies global configuration across all sections which can be overwritten.
- Route: provides a set of rules to determine what alerts get matched up with which receivers.
- Receiver: contains one or more notifiers to forward alerts to users.
At the top level there is a fallback/default route
any alerts that don’t match any of the other routes will match the default route.
these alerts will be grouped by labels alert name and job
these alerts will go to the receiver staff
Two different keywords for matching
- match_re
- matchers
- match_re vs matchers
match_reis the older way of writing regex-based matches. It only works for regex and is less flexible.matchersis the newer, recommended way. It supports multiple operators (=,!=,=~,!~) so you can match exact values or use regex.- Both achieve the same goal, but
matchersis more powerful and future-proof.
Sub-Routes:
- Every Alertmanager config has a root route that defines the default receiver.
- Sub-routes sit under the root and apply extra filtering based on labels.
- Alerts always start at the root and are checked against sub-routes in order.
- By default, processing stops at the first match, but if you want the same alert to continue to other routes, you add
continue: true.
Restarting Alertmanager
As with Prometheus, Alertmanager doesn’t automatically pick up changes to its config file. One of the following must be performed for changes to take effect.
- Restart Alertmanager
- Send a SIGHUP
- sudo killall-HUP alertmanager
- HTTP Post to /-/reload endpoint
Continue
what if we want an alert to match two routes.
route:
  receiver: default-receiver
  group_by: ['alertname', 'job']
  continue: true   # allow matching multiple child routes
  routes:
    - matchers:
        - job = "kubernetes"
      receiver: k8s-email
      continue: true
    - matchers:
        - severity = "critical"
receiver: critical-slackIn this example, all alerts are first sent to the default receiver alert-logs.
If an alert has the label job="kubernetes", it will also match the Kubernetes route and be sent to the k8s-email receiver.
By default, Alertmanager stops processing after the first matching route (“first match wins”).
To allow an alert to be delivered to multiple receivers, we can add continue: true. This tells Alertmanager to keep checking the remaining routes even after a match.
Grouping
By default alertmanager will group all alerts for a route into a single group which results in you
receiving one big notification.
The group_by field allows you to specify a list of labels to group alerts by.
A default route has its alerts grouped by the team label
Receivers
- Are responsible for taking grouped alerts and producing notifications.
Receivers contain various notifiers, which are responsible for handling the actual notification.
https://prometheus.io/docs/alerting/latest/configuration/
Now let’s configure slack channel.
- Webhook
- Generate api hooks from below url.
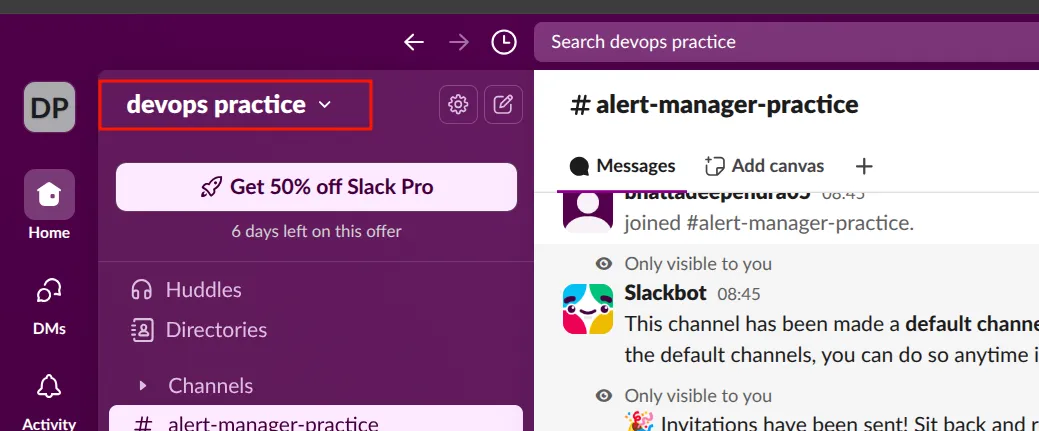
- First create a workspace in slack.
- After that create a channel channel in slack.
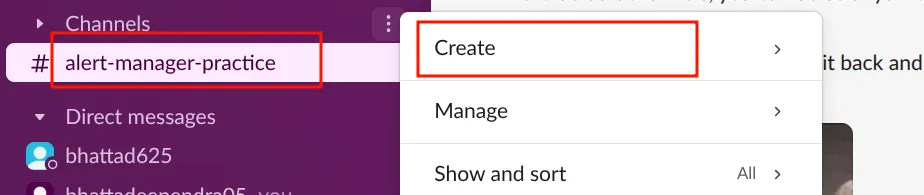
-
I have already created a one named alert-manager-practice.
-
Generate api hooks from below url.
-
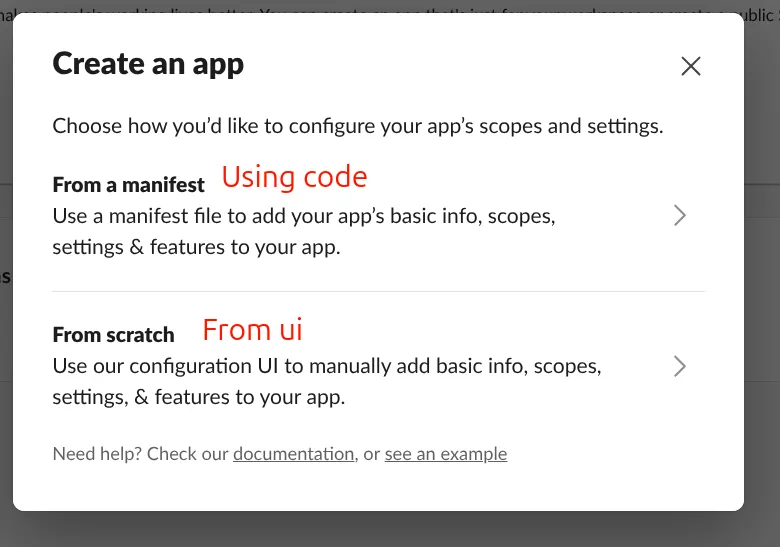
From the URL click on create an app.

- Click on from scratch
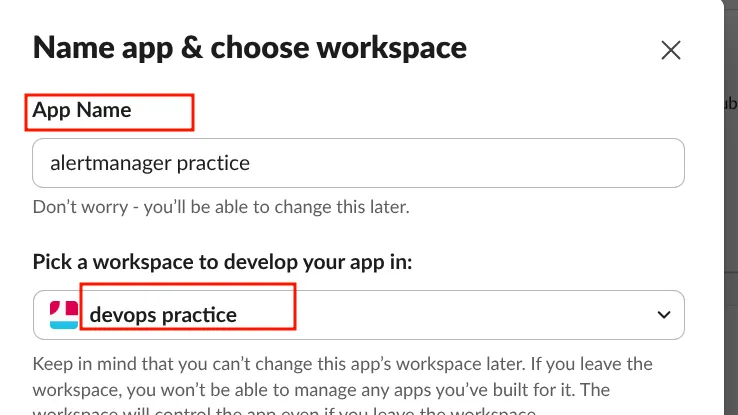
- Now fill name and pick a workspace.
- Now after that when you click on create app button you will see these credentials.
- After that click on aIncoming webhooks . Turn it on and add new webhook.
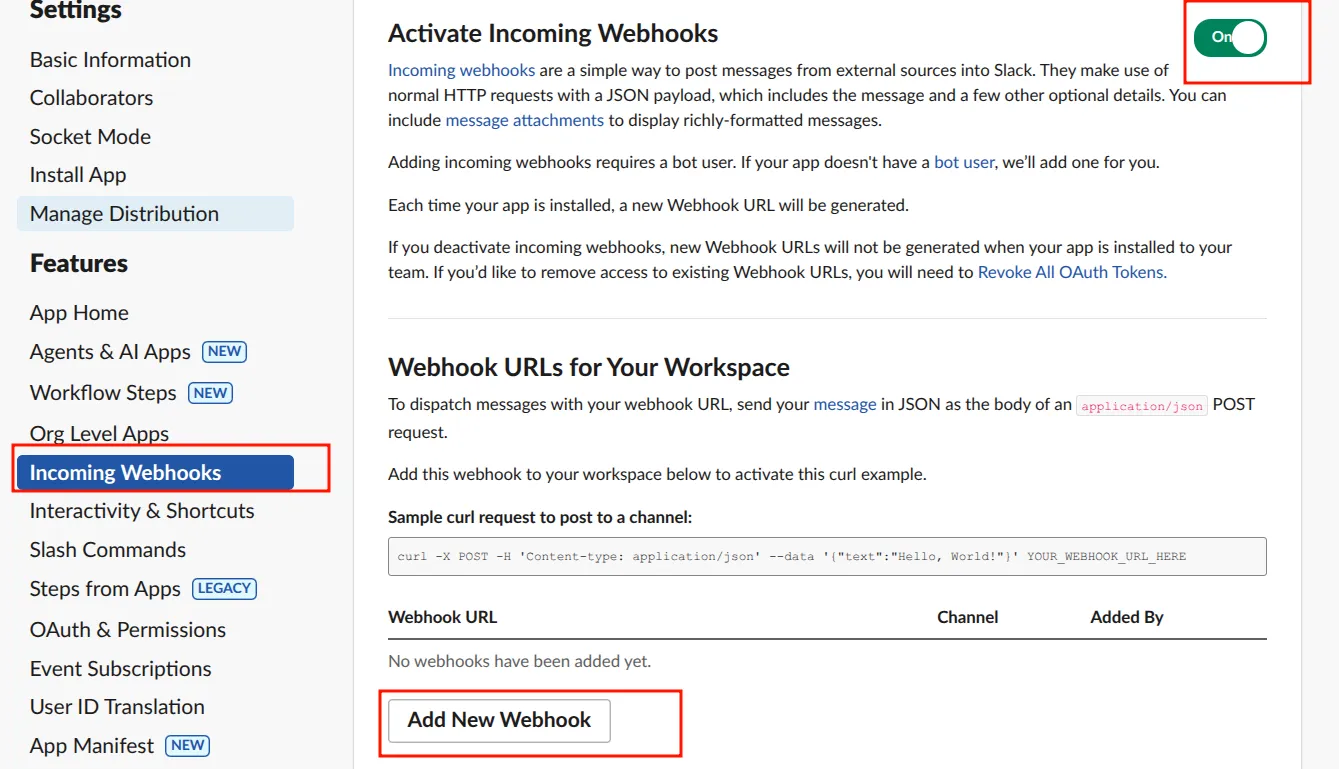
- After that provide a name and it will shows all the channels. If the channel name is not shown you can simply type the name.
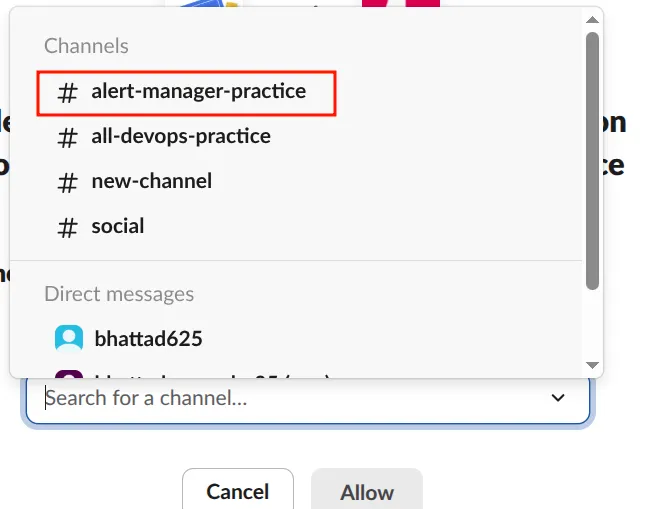
- Now if you click on allow it will generate a webhook URL.
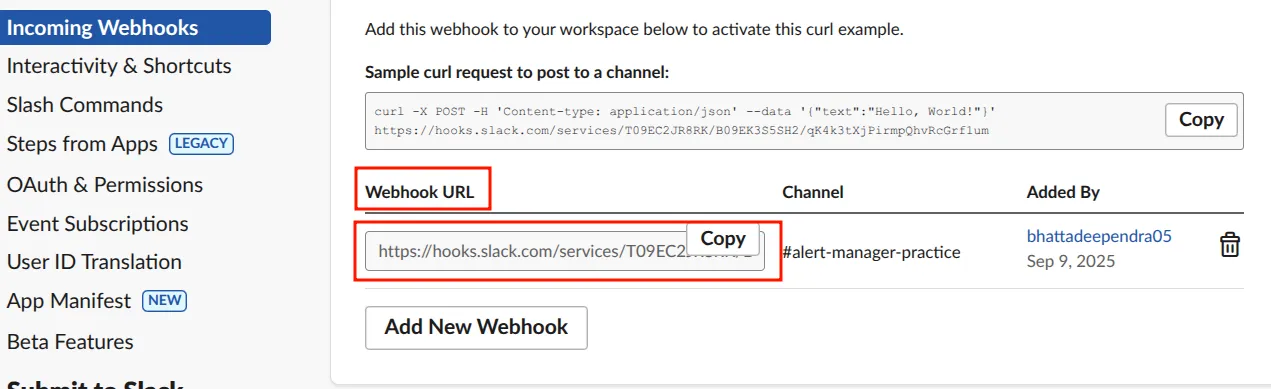
- Now we need to make changes in the alertmanager.yml file.
route: # root route
  group_by: ['alertname']       # group alerts by alertname
  group_wait: 30s               # wait before first notification
  group_interval: 5m            # min time between notifications for same group
  repeat_interval: 1h           # resend if still firing
  receiver: 'web.hook'          # default receiver
  routes:                       # sub-routes for specific alerts
    - match_re:                 # regex match on job label
        job: (Node_exporter_next_vm|Docker_engine|cAdvisor)
      group_by: ['prod', 'dev'] # group by environment
      receiver: slack           # send matched alerts to Slack

receivers:                      # all receivers
  - name: 'web.hook'            # webhook receiver
    webhook_configs:
      - url: 'http://127.0.0.1:5001/' # local webhook endpoint

  - name: slack                 # Slack receiver
    slack_configs:
      - api_url: https://hooks.slack.com/services/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
        channel: '#alert-manager-practice' # Slack channel
        title: '{{ .GroupLabels.team }} has alerts in env: {{ .GroupLabels.env }}' # uses group labels
        text: '{{ range .Alerts }}{{ .Annotations.message }}{{ "\n" }}{{ end }}'   # list all messages

inhibit_rules:                  # silence less severe alerts
  - source_match:
      severity: 'critical'      # if critical alert fires
    target_match:
      severity: 'warning'       # silence related warnings
equal: ['alertname', 'dev', 'instance'] # only if labels match- Doing this configuration will not send alerts to slack channel still. SO for this we can troubleshoot seeing this file. Here you can see the all the configuration you have done locally. If it matches youconfiguration then there is probelm in somewhere else. If it doesn’t match then you need to check the path of you file. you can see this in UI in STATUS menu.
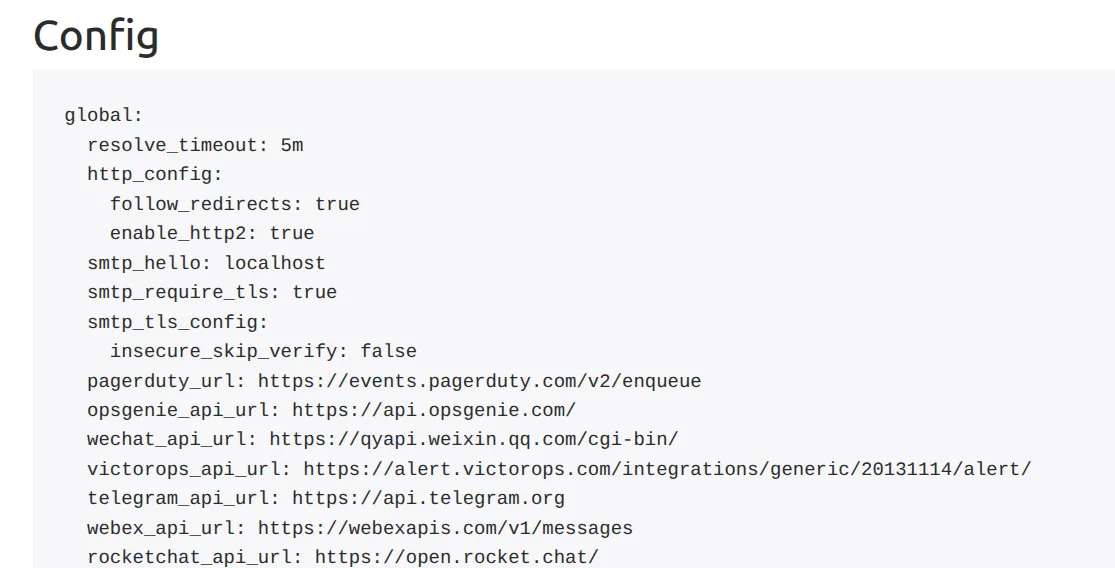
- Or we can troubleshoot using this also.
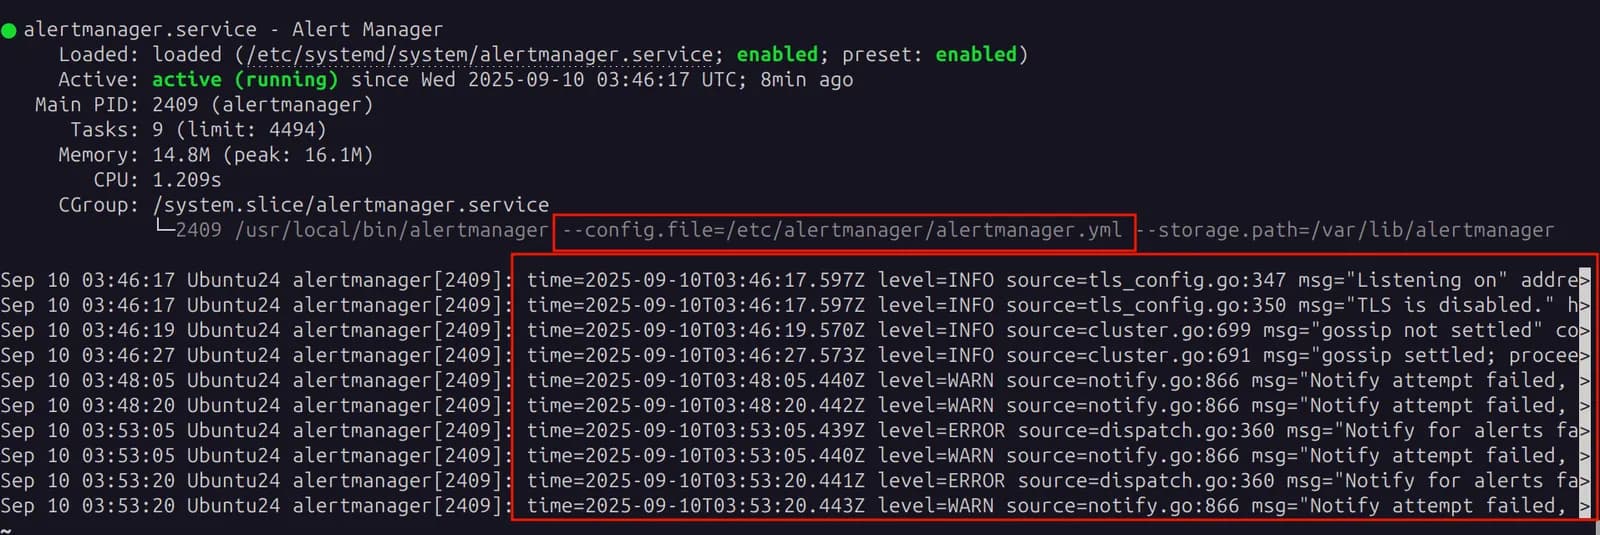
- we have done place the configuration file in wrong place. We need to place the alertmanager.yml in the path /etc/alert/alertmanager.yml If you have configured file in different path then move it to the path /etc/alert/alertmanager.yml
- After configuring all this now you can see the message in the slack channel.
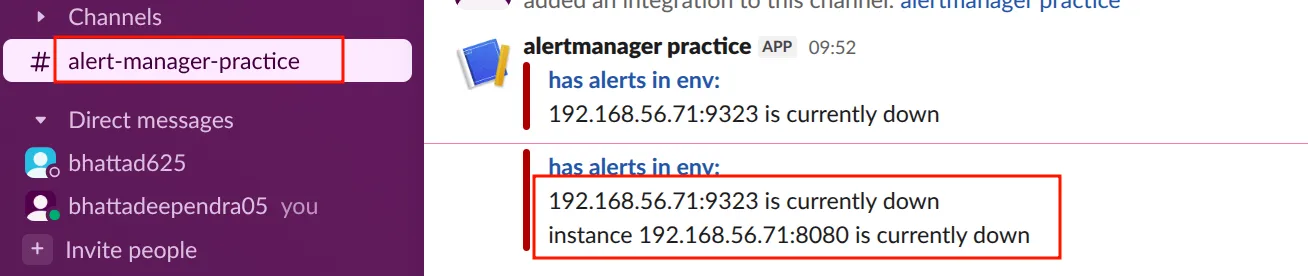
- We can configure other channels also but need to integrate their APIs here.
- In the receiver option we can configure other things also.
- in alertmanager.yml
- receivers:
- in alertmanager.yml
- This option is configured. We can also add the recovered state in the rules.yaml file. For this we need to configure the rules.yaml file in /etc/prometheus directory.
groups:
  - name: my-alerts
    interval: 15s   # how often to evaluate rules
    rules:
      # ----------------- DOWN alerts -----------------
      - alert: NodeDown
        expr: up{job="Node_exporter_next_vm"} == 0
        for: 2m
        labels:
          team: infra
          env: dev
        annotations:
          message: "🚨 instance {{ $labels.instance }} is currently DOWN"

      - alert: DockerEngineDown
        expr: up{job="Docker_engine"} == 0
        for: 0m
        labels:
          team: microservices
          env: prod
        annotations:
          message: "🚨 Docker engine on {{ $labels.instance }} is currently DOWN"

      - alert: FrontendAppDown
        expr: up{job="cAdvisor"} == 0
        for: 0m
        labels:
          team: Frontend
          env: dev
        annotations:
          message: "🚨 instance {{ $labels.instance }} (frontend) is currently DOWN"

      # --------------- RECOVERY (UP) alerts ---------------
      # These only fire when the target was recently changed and is now up.
      - alert: NodeRecovered
        expr: up{job="Node_exporter_next_vm"} == 1 and changes(up{job="Node_exporter_next_vm"}[5m]) > 0
        for: 0m
        labels:
          team: infra
          env: dev
        annotations:
          message: "✅ instance {{ $labels.instance }} has RECOVERED (UP)"

      - alert: DockerEngineRecovered
        expr: up{job="Docker_engine"} == 1 and changes(up{job="Docker_engine"}[5m]) > 0
        for: 0m
        labels:
          team: microservices
          env: prod
        annotations:
          message: "✅ Docker engine on {{ $labels.instance }} has RECOVERED (UP)"

      - alert: FrontendAppRecovered
        expr: up{job="cAdvisor"} == 1 and changes(up{job="cAdvisor"}[5m]) > 0
        for: 0m
        labels:
          team: Frontend
          env: dev
        annotations:
message: "✅ instance {{ $labels.instance }} (frontend) has RECOVERED (UP)"up{job=”Docker_engine”} == 1 and changes(up{job=”Docker_engine”}[5m]) > 0
- What each piece means (plain words)
- up{job=”Docker_engine”} == 1
- → “This Docker target is currently up (healthy).”
- up{job=”Docker_engine”}[5m]
- → “Look at the last 5 minutes of its up/down history.”
- changes(…[5m]) > 0
- → “Did the up/down value change at least once in those 5 minutes?”
- and
- → “Both conditions must be true at the same time.”
- up{job=”Docker_engine”} == 1
- So in one sentence
- “Alert me only if the Docker target is up right now and it changed state recently (in the last 5 minutes).”
- That basically detects a recent recovery (it was down, then became up), but won’t alert if it’s been up for a long time.
After that we can see the status of up is firing as the machine are up.
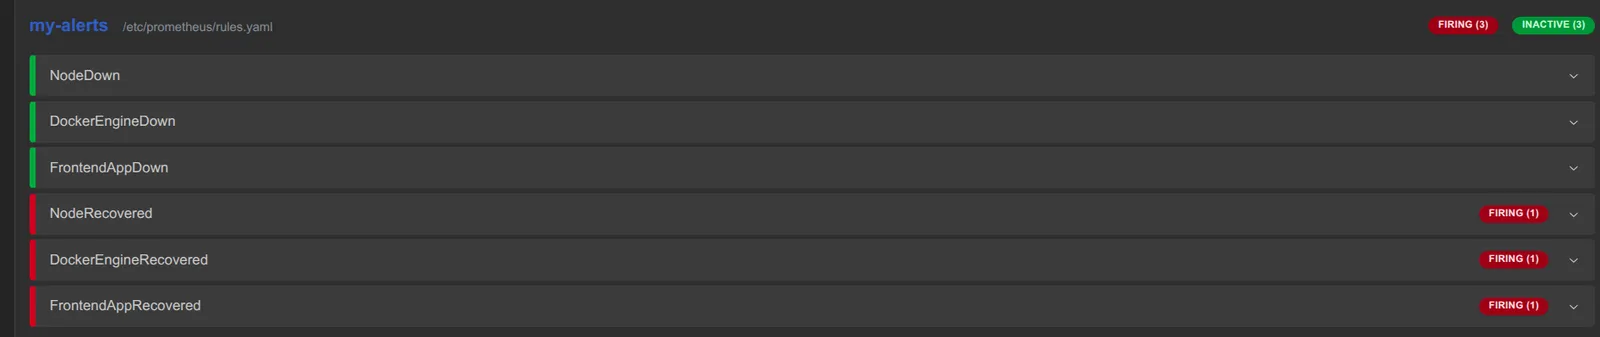
- We can also see these notification in the slack channel.
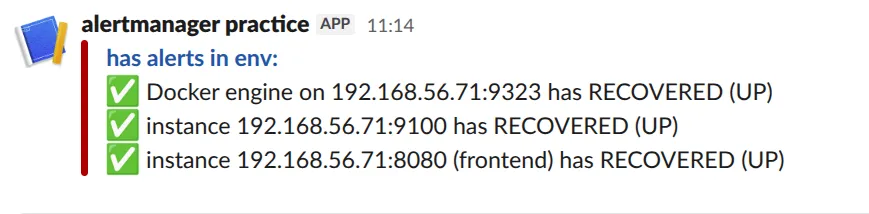
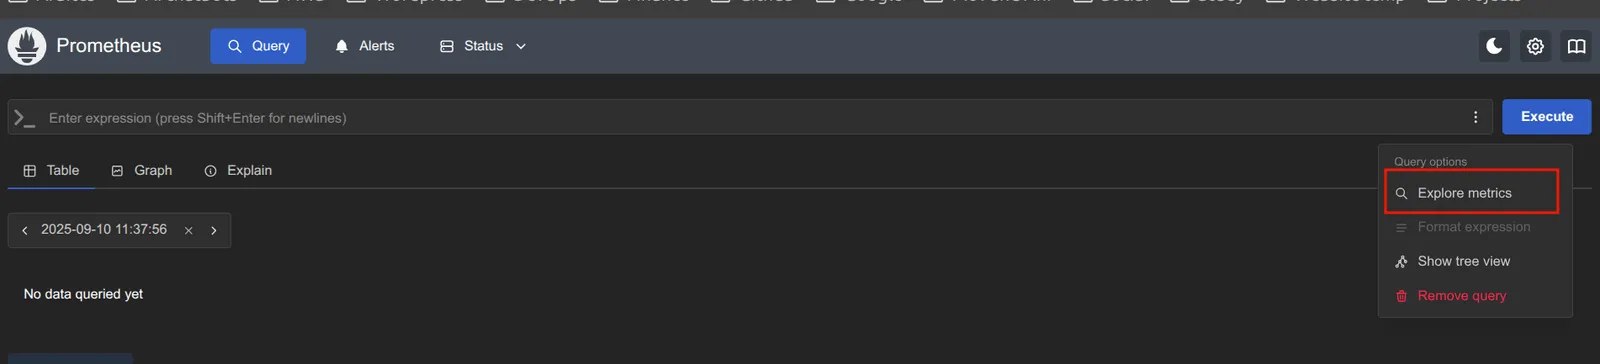
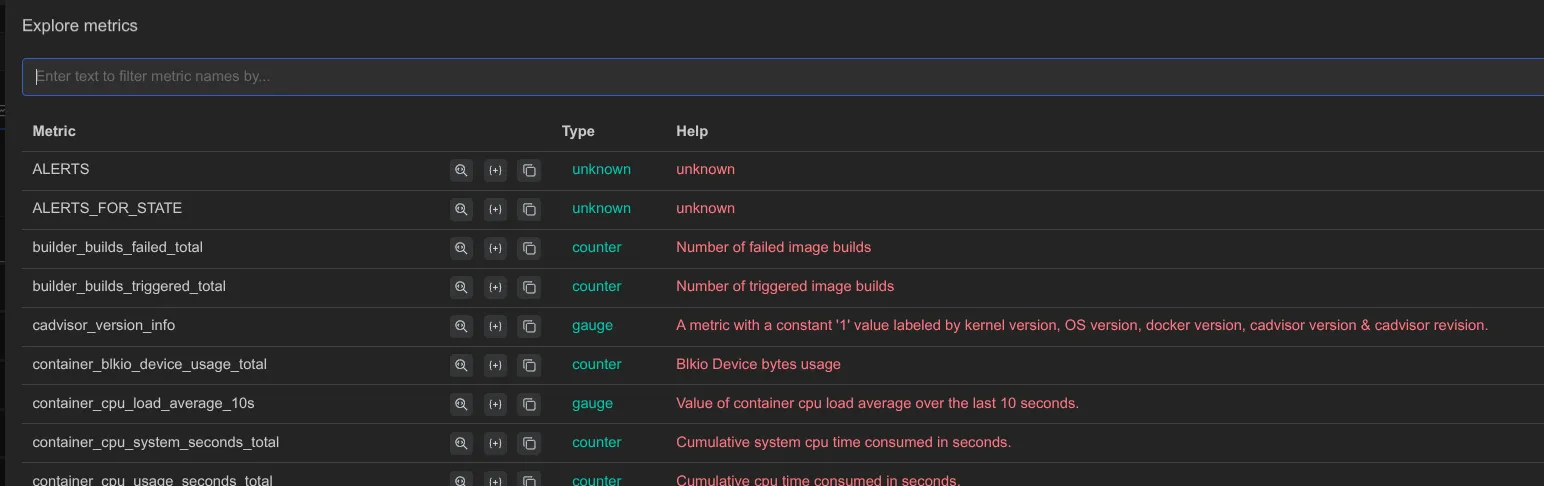
NOTE: WE can explore all other metrics from this option.
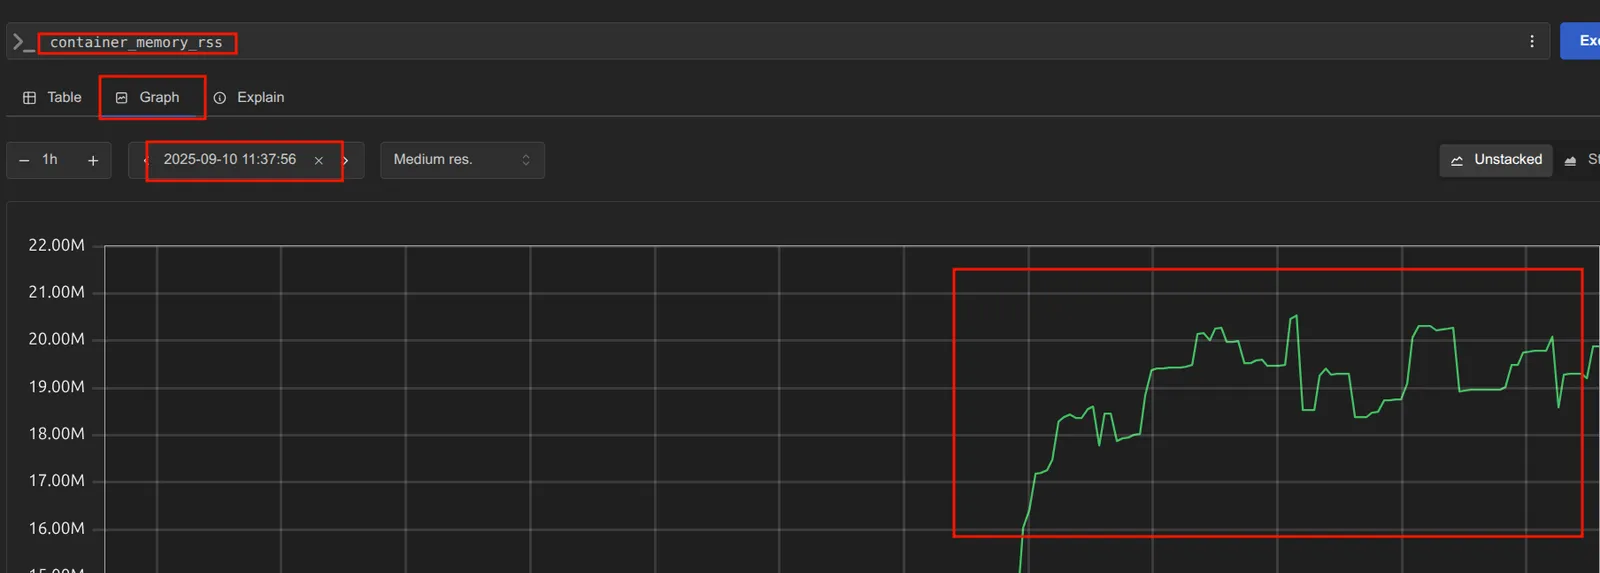
- We can simply write the query in option also.
- For example:
- For visualization we cannot visualize everything properly. So for this we have another tool called grafana.
Grafana
- We can use subscription or can we freely.
Grafana Installation
- We can run this as a docker container or can setup in our own machine.
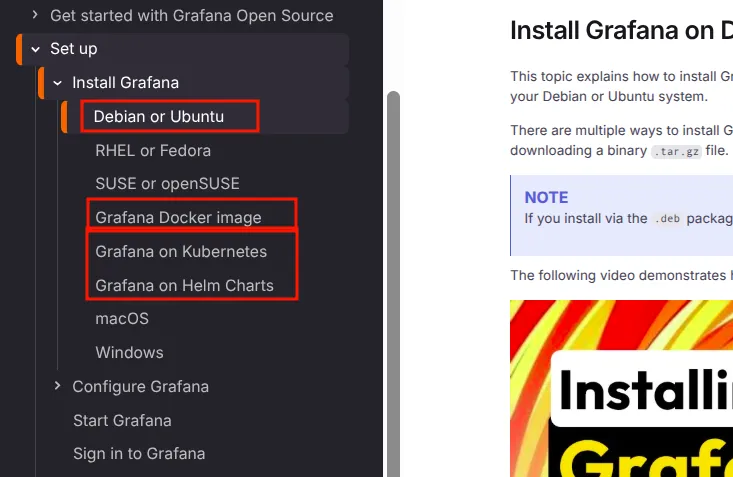
- To setup grafana you can refer to this document for detailed options. Check prequestics and other things
- For now we are go setup in ubuntu linux. For this you can setup using APT package manager or you can set up using the setup file from the official link.
- Here i am downloading package to install grafana now.
sudo apt-get install -y adduser libfontconfig1 musl
wget https://dl.grafana.com/grafana-enterprise/release/12.1.1/grafana-enterprise_12.1.1_16903967602_linux_amd64.deb
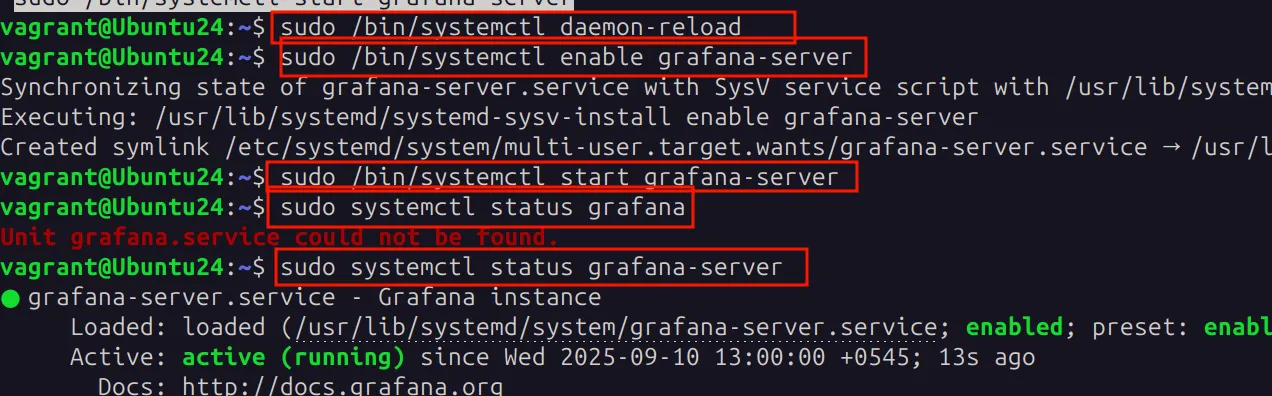
sudo dpkg -i grafana-enterprise_12.1.1_16903967602_linux_amd64.deb- You can configure grafana in any machine or in the machine where prometheus is running. After installing grafana follow on-screen prompt to start the service and now you can access the service in the port 3000. Follow this document to know about sign in.
- Now you can see login page and these are default credentials
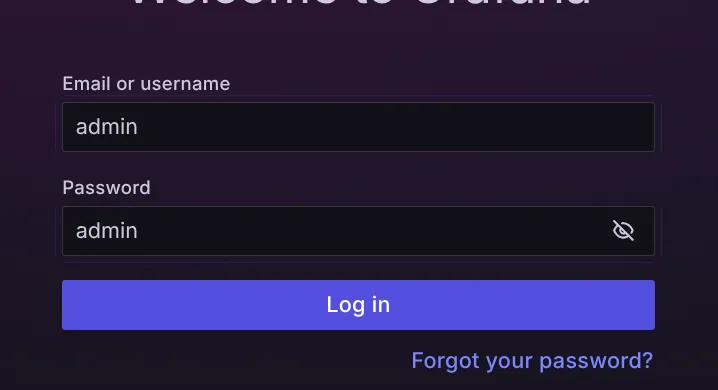
- You need to change password for security purpose.
- Now first you need to configure data source.
Data Source Configuration
- Add Prometheus URl with port.
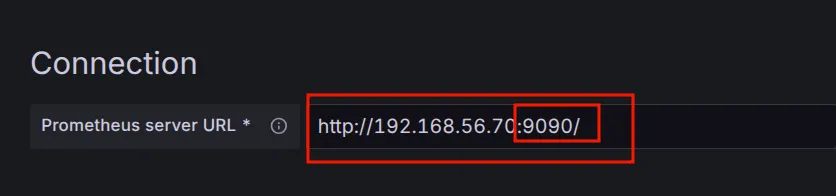
- If there is authentication then provide and add certificate it has any and save. For now i don’t have any authentication and other services so we don’t need to configure this.
- And save this. Now you need to configure Dashboard. So to configure dashboard you need configure all the things like which metrics and all other stuffs. So as a beginner it will be a bit difficult for us so we can use already created dashboard.
- You can search here any dashboard you would like to create. For now i am configuring for node exporter.
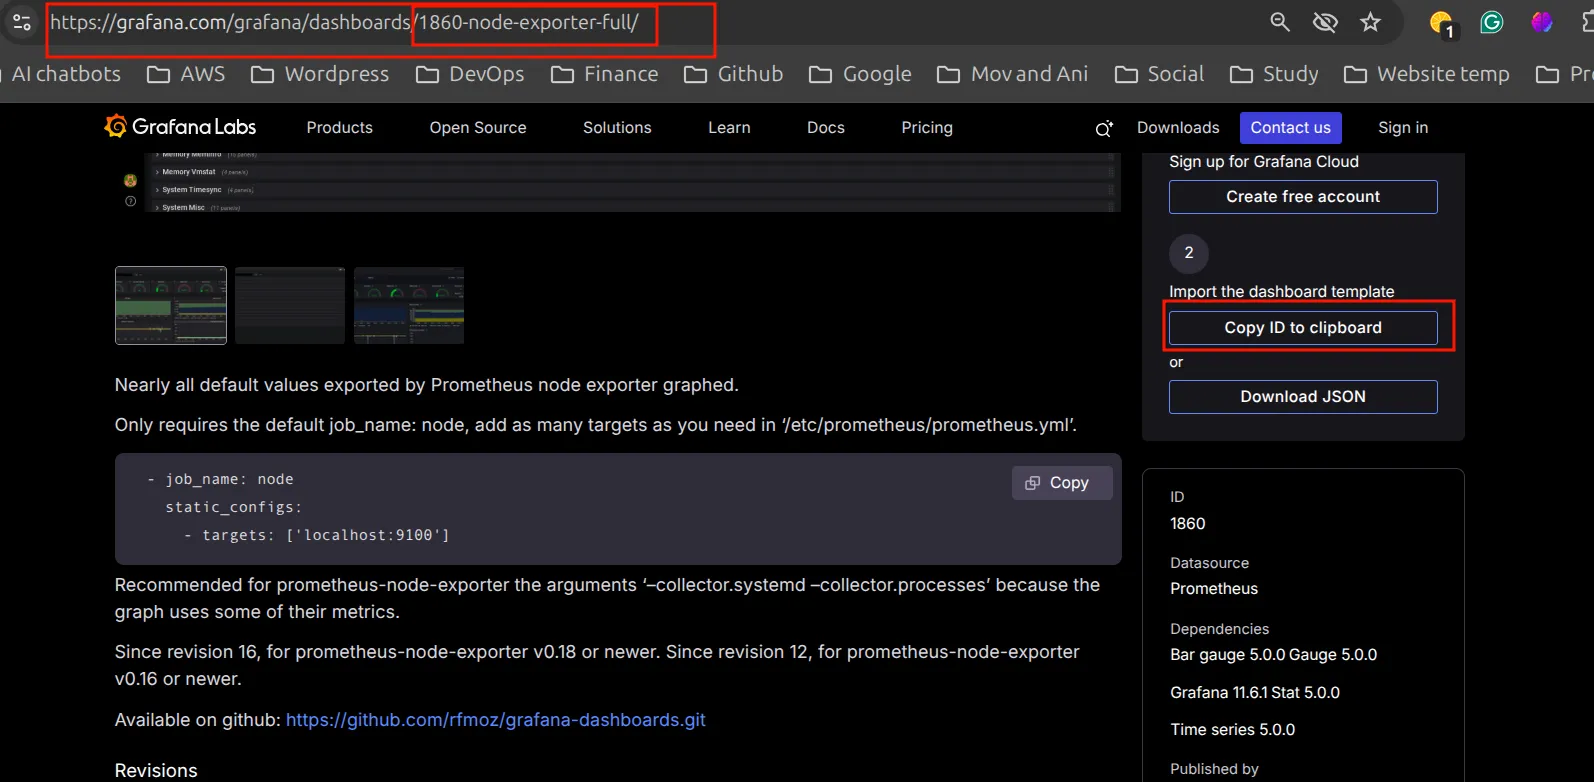
- There are three options to import the dashboard. For now i am copying the id. You can also download the json file and import that to the grafana dashboard. For now i am using ID.
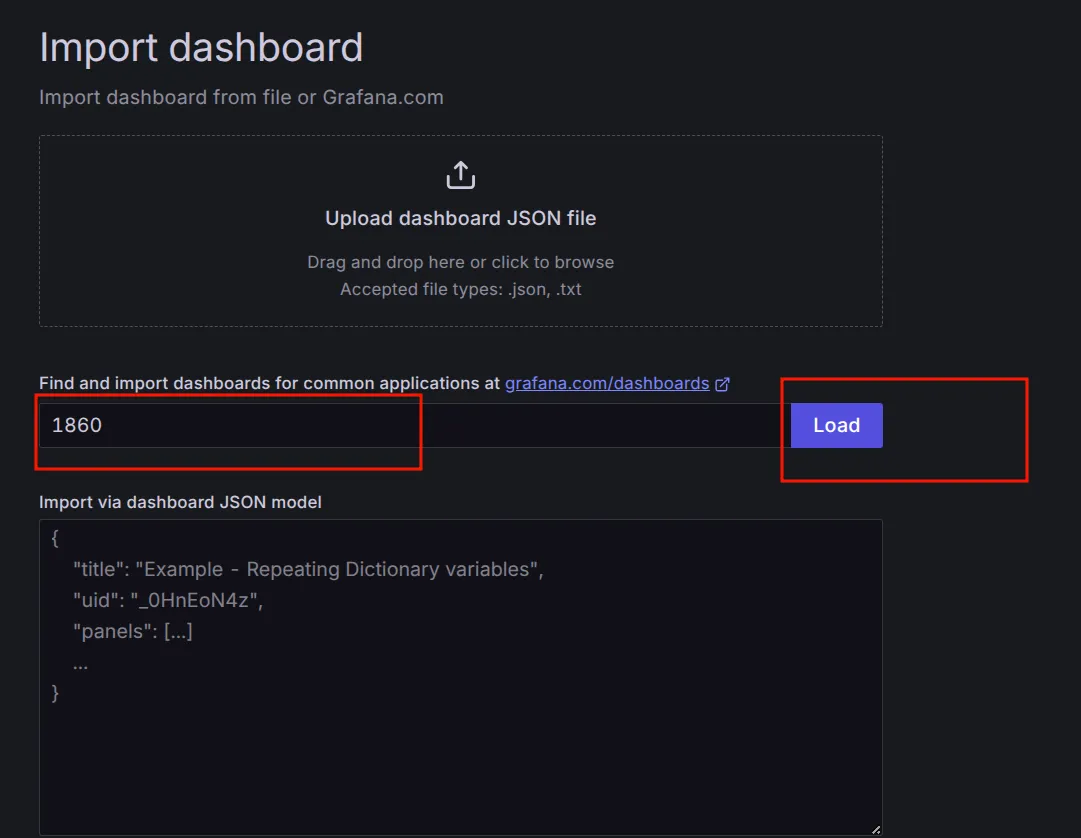
- Now you need to select the prometheus here.

- Explore other setting like add users, setting up alert rules and many more. You need to explore other dashboards based on you need.
Keep reading
- Prometheus
Observability Observability is the practice of understanding a complex system’s internal state by analyzing its external outputs, such as logs, metrics, and traces. It allows engineers to…
- Amazon S3
Amazon Simple Storage Service (Amazon S3) is an object storage service that offers industry-leading scalability, data availability, security, and performance. Customers of all sizes and industries…
- KUbernetes
Introduction kubernetes is similar to docker swarm. Kubernetes is also a container orchestration tool. We can run kubernetes in every environment example laptop, dev, production, cloud. So if there…