Prometheus
Observability Observability is the practice of understanding a complex system’s internal state by analyzing its external outputs, such as logs, metrics, and traces. It allows engineers to…

ON THIS PAGE
Observability
Observability is the practice of understanding a complex system’s internal state by analyzing its external outputs, such as logs, metrics, and traces. It allows engineers to troubleshoot, diagnose issues, and maintain system reliability by providing a complete, real-time view of a system’s behavior. Unlike traditional monitoring, which focuses on known problems, observability enables engineers to ask arbitrary questions and investigate “unknown unknowns” in dynamic, distributed environments.
Few important terminologies
1. SLI (Service Level Indicator)
- What it is: A quantitative measure of a service’s performance. It’s the raw data you track.
- Your Point: “which type of service are we getting.”
- Common SLIs:
- Error Rate: Frequency of failed requests (e.g., “0.1% of requests failed this week”).
- Latency: Time taken to serve a request (e.g., “200ms response time”).
- Availability: Proportion of time the service is up (e.g., “99.9% available”).
- Throughput: Amount of work done per second (e.g., “1000 requests/second”).
- Saturation: How “full” the service is (e.g., “CPU is 70% utilized”).
2. SLO (Service Level Objective)
- What it is: The target value or range for an SLI. It’s your internal reliability goal.
- Your Points:
- “for sli range or target value”
- “We cannot guarantee 100% availability” -> Correct! SLOs are realistic, not perfect (e.g., 99.9%).
- Example: “Error Rate must be < 0.1% over 30 days.”
3. SLA (Service Level Agreement)
- What it is: A contract between provider and user that defines consequences if SLOs are not met.
- Your Point: “contract betn provider user”
- Your Example Refined: A university’s SLA promises students credit if they complete all coursework (the SLO). If the university breaks this, it must provide a refund (consequence).
Quick Summary Table
| Concept | Role | Example |
|---|---|---|
| SLI | The metric you measure. | Error Rate = 0.15% |
| SLO | The goal for that metric. | Error Rate < 0.1% |
| SLA | The contract with penalties for missing the SLO. | “If Error Rate > 0.1%, we pay you back.” |
The Three Pillars
-
Metrics
- Definition: Numerical data points that continuously measure the health and performance of a system.
- Examples: CPU usage, memory consumption, request latency, error rate.
- Error Rate: Shows how frequently errors occur in the system (e.g., 5 errors per 1000 requests = 0.5% error rate). Helps identify instability or service degradation.
-
Logs
- Definition: Text-based records of events generated by applications, systems, or infrastructure.
- Purpose: Provide detailed context about what happened, when, and how.
- Examples:
- Timestamp (🕒 When it happened).
- Source (💻 Which service/system generated it).
- Event details (⚙️ What action or error occurred).
- Use Case: Debugging and root-cause analysis (e.g., why an application crashed at 2:35 AM).
-
Traces
- Definition: Track the full lifecycle of a request as it travels across multiple services or components.
- Purpose: Reveal dependencies, bottlenecks, and latency issues in distributed systems.
- Example: When a user loads a webpage, traces show how the request moves from the frontend → backend → database → external APIs, highlighting where delays occur.
Example: How DNS Works (using traces as analogy)
When you type www.google.com in your browser:
- System DNS Resolver:
- Checks local cache.
- If the IP for
www.google.comis already stored, it resolves immediately.
- Root DNS Servers (if not cached):
- Directs the query to the correct Top-Level Domain (TLD) server (e.g.,
.com).
- Directs the query to the correct Top-Level Domain (TLD) server (e.g.,
- TLD DNS Servers:
- Point the query to the Authoritative DNS server for
google.com.
- Point the query to the Authoritative DNS server for
- Authoritative DNS Server:
- Provides the final IP address (e.g.,
142.250.190.36).
- Provides the final IP address (e.g.,
- Browser connects using IP:
- Now the browser can reach the Google server using the IP, not the name.
👉 Traces in observability are similar: they follow the “path” of a request step by step, showing where delays or failures occur.
Why observability matters?
- Faster Issue Resolution
- Engineers can quickly find the root cause of a problem.
- Example: Suppose an e-commerce site crashes during a sale. With logs and traces, the team sees that the payment service failed because the database ran out of connections. Instead of checking every service manually, they fix the database pool and bring the site back up faster.
- Proactive Problem Solving
- Detecting and solving problems before users notice.
- Example: In AWS CloudWatch, you set an alarm: If CPU usage goes above 60% for 5 minutes, automatically add a new server (auto-scaling). This way, your website doesn’t slow down when traffic spikes—users never experience the issue.
- Improved Performance
- Optimize how resources are used.
- Example: Observability shows that most traffic to your app comes at night. You can scale down servers in the daytime (to save cost) and scale up at night (to keep performance fast).
- Enhanced Reliability
- Keeping systems stable and online.
- Example: A ride-sharing app (like Uber) monitors its services. If one region’s server goes down, observability helps quickly reroute traffic to another region. Riders and drivers don’t face long downtime.
- Better Decision-Making
- Making smart choices based on data.
- Example: Observability shows that 70% of user complaints come from slow mobile performance. Instead of spending money on new servers, the team invests in optimizing mobile API calls. The decision is backed by data, not guesswork.
Monitoring vs Observability
Monitoring
- Definition: Watching systems using pre-defined metrics, alerts, and thresholds.
- Purpose: Detect known issues.
- How it works: You set rules like “Alert me if CPU > 80%” or “Send a warning if memory < 10% free”.
- Example:
- A server’s disk space is 95% full. Monitoring sends an alert: “Disk space critical.”
- The team knows what the problem is (disk is full) and can fix it by cleaning logs or adding storage.
👉 Think of it like a car dashboard: the fuel gauge tells you when fuel is low, or the check-engine light comes on when something predefined happens.
Observability
- Definition: A deeper approach that allows you to explore system behavior—even for issues you didn’t plan for.
- Purpose: Diagnose unknown, complex problems.
- How it works: Uses metrics, logs, and traces together so engineers can ask open-ended questions: “Why is latency high only for users in Europe?” or “Why do payments fail randomly at midnight?”
- Example:
- Users complain that the app is “slow.” Monitoring shows CPU is fine and memory is fine (so no obvious alert).
- With observability, traces reveal that 70% of delays happen in the payment API calls to a third-party service. Logs confirm timeout errors. Now the team knows the real cause: not the servers, but an external dependency.
Tools for observability
Observability tools usually cover one or more of the three pillars: Metrics, Logs, and Traces.
- Proprietary (Commercial / Paid) Tools
- These are full-featured platforms with support and integrations.
- Datadog → Cloud monitoring & observability (metrics, logs, traces, dashboards).
- New Relic → Application performance monitoring (APM) and observability.
- Dynatrace → AI-powered monitoring for cloud and microservices.
- Splunk → Strong for log management and security analytics.
- LogRhythm → Security + log management tool (SIEM focus).
- These are full-featured platforms with support and integrations.
- Open-Source Tools
- Great for learning and also used in production by many companies.
- Prometheus → Popular for metrics collection + alerting (often paired with Grafana).
- Grafana → Visualization dashboards (connects with Prometheus, Loki, etc.).
- Jaeger → Distributed tracing (great for microservices).
- ELK Stack (Elasticsearch, Logstash, Kibana) → Log management and visualization.
- OpenTelemetry → Standard framework for collecting metrics, logs, and traces.
- Loki → Lightweight log aggregation by Grafana Labs.
- Great for learning and also used in production by many companies.
- Cloud-Native Tools (from big providers
- If you use AWS, Azure, or GCP, they have built-in observability tools.
- AWS CloudWatch → Metrics, logs, alarms, dashboards.
- AWS X-Ray → Distributed tracing.
- Azure Monitor → Unified monitoring for Azure services.
- Google Cloud Operations (Stackdriver) → Logs, metrics, and traces for GCP.
- If you use AWS, Azure, or GCP, they have built-in observability tools.
Prometheus
Prometheus is an open-source monitoring and alerting toolkit that has become the industry standard for keeping applications healthy. Born at SoundCloud in 2012, it’s now trusted by thousands of organizations worldwide and is the second project hosted by the Cloud Native Computing Foundation, right after Kubernetes.
Prometheus Main Features
- Multi-Dimensional Data Model with Time Series
- Prometheus stores time series data identified by metric name and key/value pairs (labels). Each data point includes the value and exact timestamp when recorded.
- Instead of separate metrics like
web_server_requestsandapi_requests, Prometheus uses one metric with multiple dimensions:
http_requests_total{method="GET", endpoint="/api/users", status="200"} 1547
http_requests_total{method="POST", endpoint="/api/orders", status="500"} 23- PromQL: Flexible Query Language to Leverage Dimensionality
- PromQL harnesses the power of this multi-dimensional model:
- “Show me error rates for all API endpoints in the last hour”
- “Which servers have CPU usage above 80%?”
- “What’s the 95th percentile response time for user login requests?”
- PromQL harnesses the power of this multi-dimensional model:
- No Reliance on Distributed Storage – Autonomous Single Server Nodes
- Each Prometheus server operates completely independently:
- Stores data locally in its own time series database
- No need for complex distributed storage setup
- If one server fails, others continue working normally
- Simple to deploy and maintain
- Each Prometheus server operates completely independently:
- Time Series Collection via Pull Model Over HTTP
- Unlike push-based systems, Prometheus actively pulls metrics from applications:
- Scrapes targets at regular intervals (default: every 15 seconds)
- Applications expose metrics on HTTP endpoints (like
/metrics) - Prometheus reaches out and collects the data
- Unlike push-based systems, Prometheus actively pulls metrics from applications:
- Push Support via Intermediary Gateway
- For applications that can’t be scraped directly, pushing time series is supported through the Push Gateway:
- Short-lived batch jobs that finish before Prometheus can scrape them
- Jobs behind firewalls or NAT
- Scheduled tasks that run briefly
- For applications that can’t be scraped directly, pushing time series is supported through the Push Gateway:
- Target Discovery via Service Discovery or Static Configuration
- Prometheus finds what to monitor through two methods:
- Static Configuration: Manually define targets
- Service Discovery: Automatically discover targets
- Kubernetes pods and services
- AWS EC2 instances
- Consul services
- DNS records
scrape_configs:
  - job_name: 'web-servers'
    static_configs:
- targets: ['server1:8080', 'server2:8080']- Multiple Modes of Graphing and Dashboarding Support
- Prometheus integrates with various visualization tools:
- Built-in Expression Browser: Basic graphs and tables
- Grafana: Rich, interactive dashboards with advanced visualizations
- Custom dashboards: Via Prometheus HTTP API
- Console templates: Built-in templating system for custom views
- Prometheus integrates with various visualization tools:
Understanding Metrics in Prometheus
Metrics are numerical measurements that change over time. What users want to measure differs from application to application. For a web server, it could be request times; for a database, it could be the number of active connections or active queries, and so on. Prometheus focuses on four types:
Real Prometheus Examples:
- Counters (always increase):
prometheus_http_requests_total– Total HTTP requests receivedprometheus_notifications_total– Total alerts sent
- Gauges (can go up/down):
prometheus_tsdb_head_memory_usage_bytes– Current memory usageup– Whether a target is currently reachable (1 or 0)
- Histograms (measure distributions):
prometheus_http_request_duration_seconds– How long requests take- Shows data in buckets: under 0.1s, under 0.5s, under 1s, etc.
- Summaries (Similar to histograms):
prometheus_rule_evaluation_duration_seconds– Time to process alerting rules- Includes quantiles like 50th, 90th, 95th percentile
The Prometheus Ecosystem
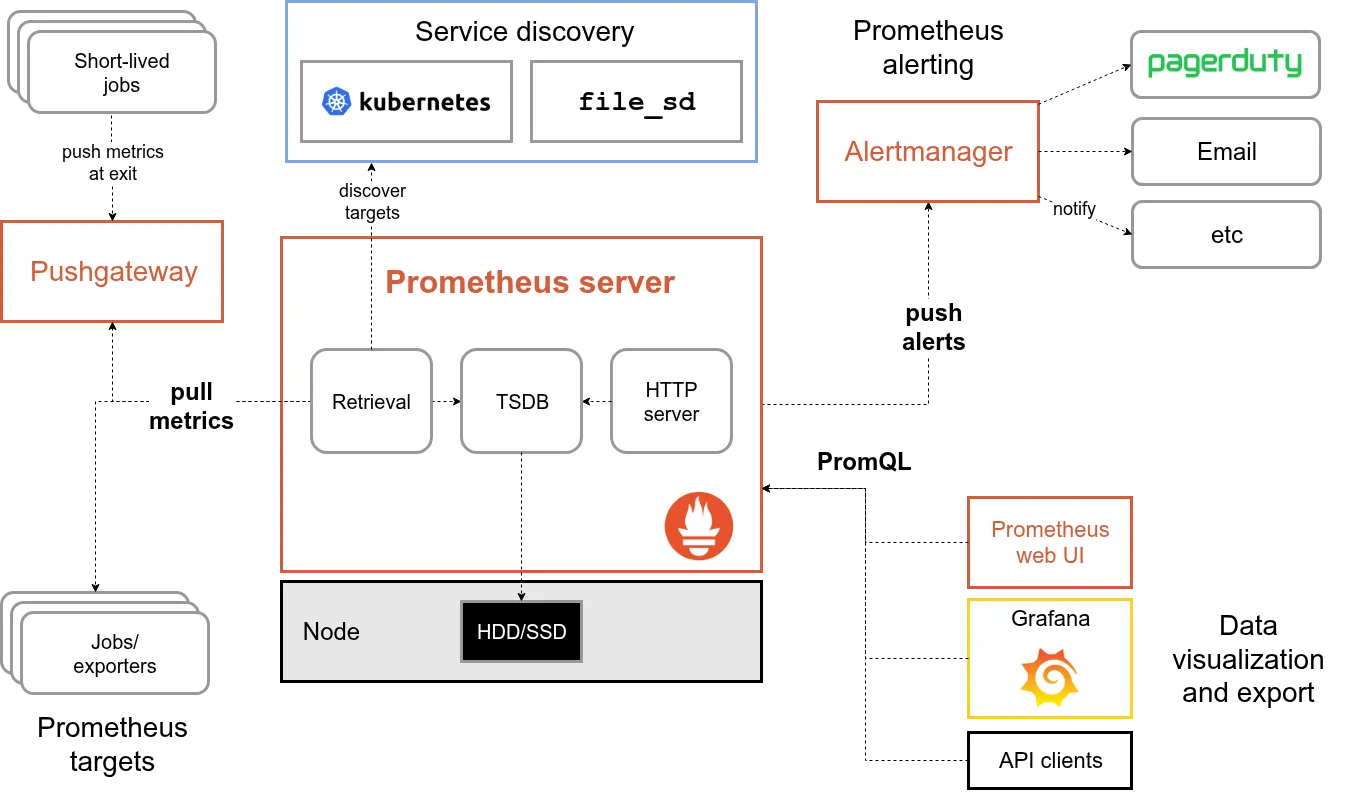
Short explaination of diagram
- 1. Target Discovery: How Prometheus Finds What to Monitor
- Static Configuration: You directly provide the IPs/hostnames of targets (e.g., an Ubuntu VM, a web server).
- Dynamic Service Discovery: Prometheus automatically discovers targets in dynamic environments like Kubernetes. It finds new pods, services, or nodes as they are created or destroyed, without manual intervention.
- 2. Data Retrieval: Getting the Metrics
- Targets expose metrics in a specific format on an HTTP endpoint (often
/metrics). - A Metrics Exporter is often used. This is a helper service that translates application metrics into the format Prometheus understands. For example, the Node Exporter pulls hardware/OS metrics from a Linux server.
- Prometheus scrapes (pulls) these metrics from all its configured targets on a set schedule.
- Targets expose metrics in a specific format on an HTTP endpoint (often
- 3. Storage: Where the Data Lives
- The scraped metrics are stored in Prometheus’s built-in Time Series Database (TSDB) on its local disk (HDD/SSD).
- This storage can be on the same machine or a separate, dedicated one for performance.
- 4. Querying and Visualization: Making Sense of the Data
- Prometheus Web UI: Provides a basic interface where you can run PromQL (Prometheus Query Language) to explore and query the collected metrics.
- Grafana: A powerful visualization tool that connects to Prometheus. It’s the preferred way to build rich, interactive dashboards using PromQL queries.
- 5. Alerting: Proactive Notifications
- You define alert rules in Prometheus (e.g., “CPU usage > 90% for 5 minutes”).
- When a rule is triggered, Prometheus sends an alert to the Alertmanager.
- The Alertmanager then handles routing, deduplication, and sending notifications via channels like email, Slack, or PagerDuty.
- 6. Special Case: Short-Lived Jobs
- For temporary tasks that don’t run long enough to be scraped (e.g., cron jobs), the Pushgateway is used.
- These jobs push their metrics to the Pushgateway.
- Prometheus then scrapes the Pushgateway to retrieve those metrics, acting as a temporary cache.
In essence, Prometheus is a powerful, all-in-one system for collecting, storing, querying, and alerting on time-series data from modern, dynamic infrastructures.
Core Components:
- Prometheus Server: The main component that scrapes metrics, stores them locally, and provides a query interface.
- Web scraping
- Web scraping is a software technique for automatically extracting information from websites, typically by fetching their underlying HTML code and then parsing it to locate and save specific data, such as product prices, news, or contact details.
- In simple terms going to specific website, collect, extract important information analyze them and publish the report. In current share market scenario they collect data from multiple sources using AI tools, writing scripts and make the data easy to read and understand. It will help us to visualize the trends in the market.
- Web scraping
- Client Libraries: Code you add to your applications to expose metrics. Available for Go, Java, Python, and other languages.
- If you have application, the logs should be pulled by the promethus. Bu using promethus we can configure this.
- Push Gateway: For short-lived jobs (like batch processes) that can’t be scraped directly – they push metrics here instead.
- In this case the push gateways keeps the logs at promethus certain end point and the promethus now will pull the data from there.
Supporting Tools:
- Exporters: Pre-built components that expose metrics from existing systems:
- For example; you have promethus and 2 ubuntu vm. SO if you want to collect the logs of vm to the promethus then you will need some tool. So these tools will expose these logs so that promethus can collect the data.
- Node Exporter: Hardware metrics (CPU, memory, disk)
- Blackbox Exporter: Website uptime and response times
- Database Exporters: MySQL, PostgreSQL, Redis metrics
- HAProxy, Nginx Exporters: Web server metrics
- For example; you have promethus and 2 ubuntu vm. SO if you want to collect the logs of vm to the promethus then you will need some tool. So these tools will expose these logs so that promethus can collect the data.
- Alertmanager: Handles alerts from Prometheus:
- Promethus cannot send alerts directly. The alert manager helps to generate alerts and help to send notifications in different interfaces and chatbots.
- Groups similar alerts together
- Sends notifications via email, Slack, PagerDuty
- Manages alert routing and silencing
- Promethus cannot send alerts directly. The alert manager helps to generate alerts and help to send notifications in different interfaces and chatbots.
- Grafana Integration: Creates beautiful dashboards and visualizations from Prometheus data.
When Prometheus Fits (and When It Doesn’t)
- Perfect For:
- Numeric Time Series: Prometheus excels at recording any purely numeric measurements that change over time.
- Machine-Centric Monitoring: Server metrics, container stats, hardware monitoring.
- Microservices Architectures: Multi-dimensional data collection shines in highly dynamic, service-oriented environments.
- Reliability-First Scenarios: Designed to be the system you turn to during outages for quick problem diagnosis.
- Independent Operation: Each server works standalone – you can rely on it even when other infrastructure fails.
- Not Ideal For:
- 100% Accuracy Requirements: If you need perfect precision (like per-request billing), Prometheus may not capture every single event due to its sampling nature.
- Detailed Audit Trails: For billing or legal compliance requiring complete transaction records, use specialized systems alongside Prometheus for monitoring.
- Event Logging: Prometheus focuses on metrics, not detailed event logs or traces.
How to install prometheus
Simple installations
Method 1: You can also run prometheus in docker container. TO run prometheus in docker container you can follow this link.
You need to map volume when you want to install using docker.

Method 2: You can install prometheus by downloading packages from official document.
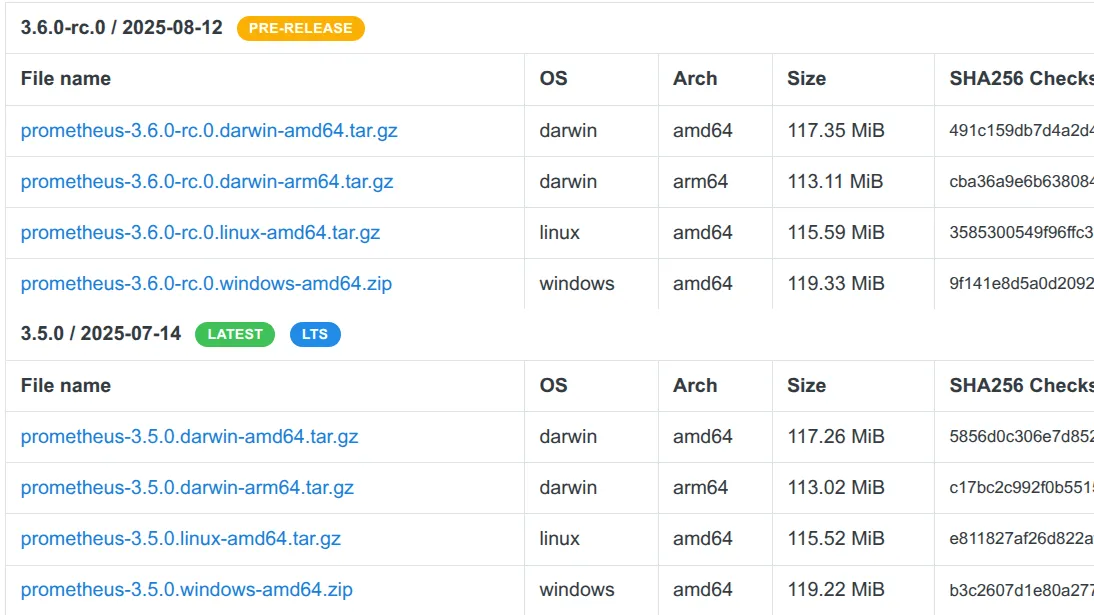
- For testing or your exploration purpose you can choose any version but for production environment you need to install lts support.
- Run this command to download latest prometheus for linux. I have copied the link from official document it is better to copy from there.
wget https://github.com/prometheus/prometheus/releases/download/v3.5.0/prometheus-3.5.0.linux-amd64.tar.gz- After that you will see a file like this and need to extract that file.

tar xzvf prometheus-3.5.0.linux-amd64.tar.gzAfter running this command you will see some of these files.
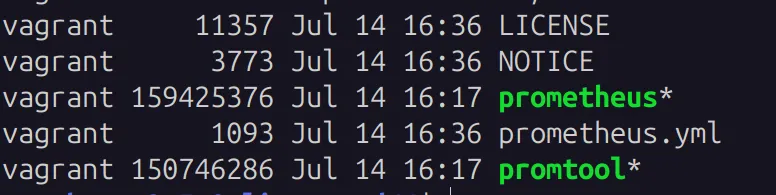
- prometheus: Executable Binary for prometheus
- prometheus.yml: All the future configuration that we want to do in prometheus is done in this file.
- Promtool: Used to do query in prometheus.
./prometheus: Using this command you can run the prometheus
./prometheus &: You can run the prometheus in background.
- Now you have installed and successfuly runned it you can now access this at port
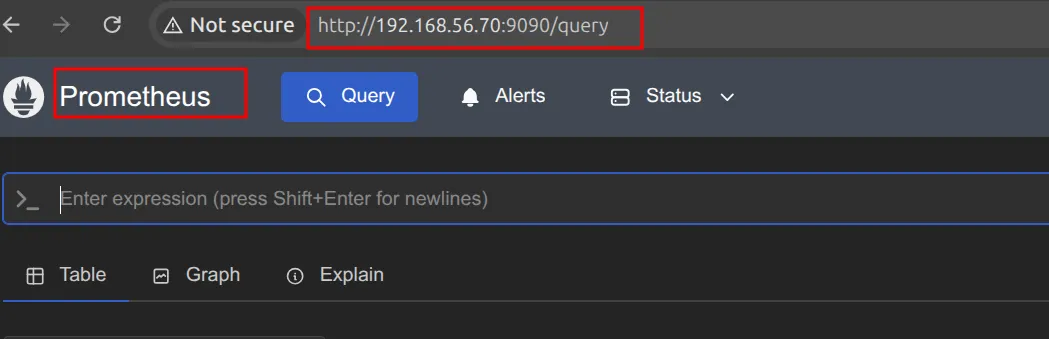
But this approach is not beginner friendly and cannot be used in long run. We used systemctl command to manage service. So to kill this service it is difficult. Using htop or top command using see this or we can use ps aux | grep prometheus command to see the pid and confirm whether it is running or not. So to stop it we need to kill the pid. so this is not beginner friendly.

Now if yow want to stop this you can do this by using command sudo pkill -9 1725. But this is too complex to each and every time kill and start the process. Instead of this we will configure system ctl for prometheus.
Using Script to install prometheus
- First we need to install prometheus. Install this using the script below. Install the prometheus and enable systemctl we can use this script. Follow this github link to see the code in the github.
#!/bin/bash
#change this version by looking at offical link
PROMETHEUS_VERSION="v3.5.0""
PROMETHEUS_FILE="prometheus-3.5.0.linux-amd64"

#To manage this with the systemctl we need to create system file.
#adding normal user to create system file
sudo useradd --no-create-home --shell /bin/false prometheus
#create a dir

sudo mkdir /etc/prometheus

#create another dir
#Creating these directories to keep the configurations files

sudo mkdir /var/lib/prometheus
sudo chown prometheus:prometheus /etc/prometheus
sudo chown prometheus:prometheus /var/lib/prometheus

#Downloaded the binaries using wget
wget https://github.com/prometheus/prometheus/releases/download/"${PROMETHEUS_VERSION}"/"${PROMETHEUS_FILE}".tar.gz
tar xvf "${PROMETHEUS_FILE}".tar.gz
cd "${PROMETHEUS_FILE}"

#copied the binaries and tool
sudo cp prometheus /usr/local/bin/
sudo cp promtool /usr/local/bin

#Changed the ownership to the user that we have created earlier
sudo chown prometheus:prometheus /usr/local/bin/prometheus
sudo chown prometheus:prometheus /usr/local/bin/promtool

#Copied the prometheus.yml file.
sudo cp prometheus.yml /etc/prometheus/prometheus.yml
sudo chown prometheus:prometheus /etc/prometheus/prometheus.yml
cd -

#copied the service file that will configure enable the systemctl for prometheus. The code of this service file is explained below.
sudo cp prometheus.service /etc/systemd/system/prometheus.service

#Before enabling the service we need to reload the daemon
sudo systemctl daemon-reload

#Starting and enabling service and checking status
sudo systemctl start prometheus
sudo systemctl enable prometheus
sudo systemctl status prometheusNOTE: Here in latest version there is no console files so you can remove that from the script
prometheus.service //To managed using systemctl or systemd
[Unit]
Description=Prometheus
#What are the additional service it need

Wants=network-online.target
After=network-online.target

[Service]
User=prometheus
Group=prometheus
Type=simple

#Start scrip location / binaries
ExecStart=/usr/local/bin/prometheus \
#File required in prometheus that we have seen while installing manually
    --config.file /etc/prometheus/prometheus.yml \
    --storage.tsdb.path /var/lib/prometheus/ \
    --web.console.templates=/etc/prometheus/consoles \
    --web.console.libraries=/etc/prometheus/console_libraries

[Install]
WantedBy=multi-user.targetAfter that we can see it is successfully installed:
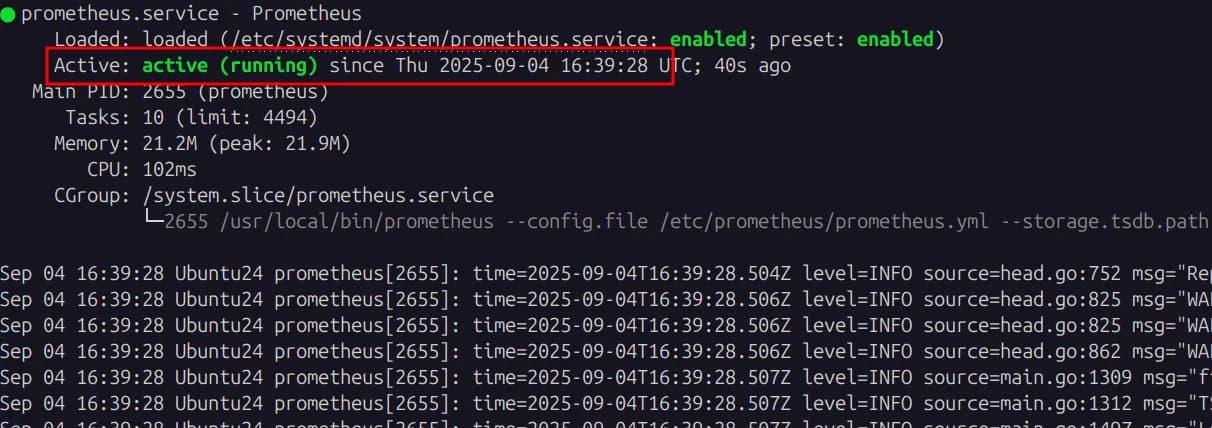
Now we can manage prometheus using systemctl command. Now try to access using ip address of machine and port. ie;
ip_address:9090
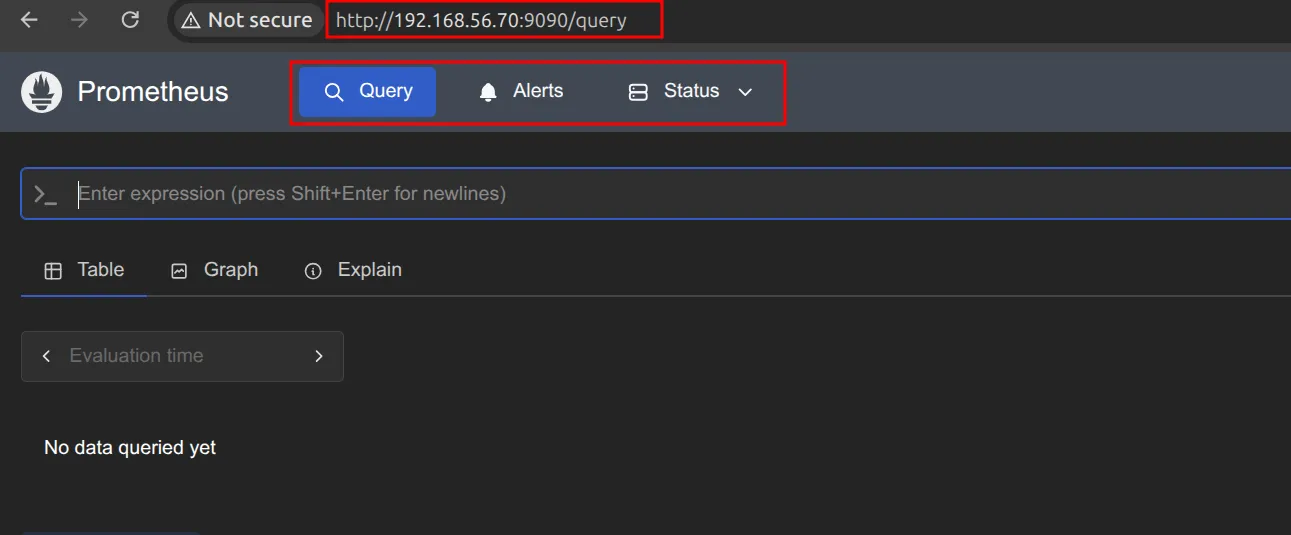
Console overview
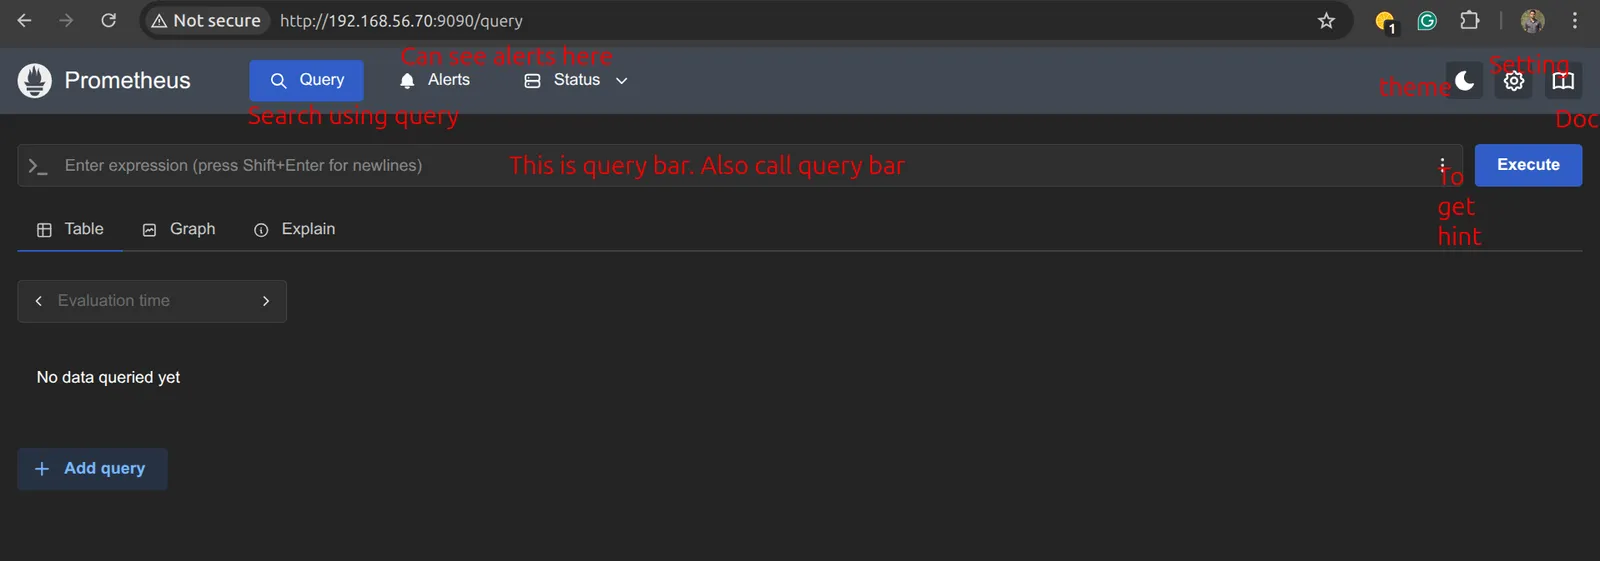
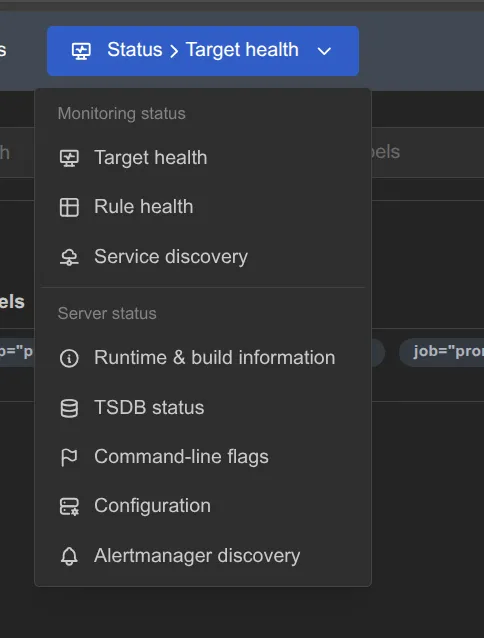
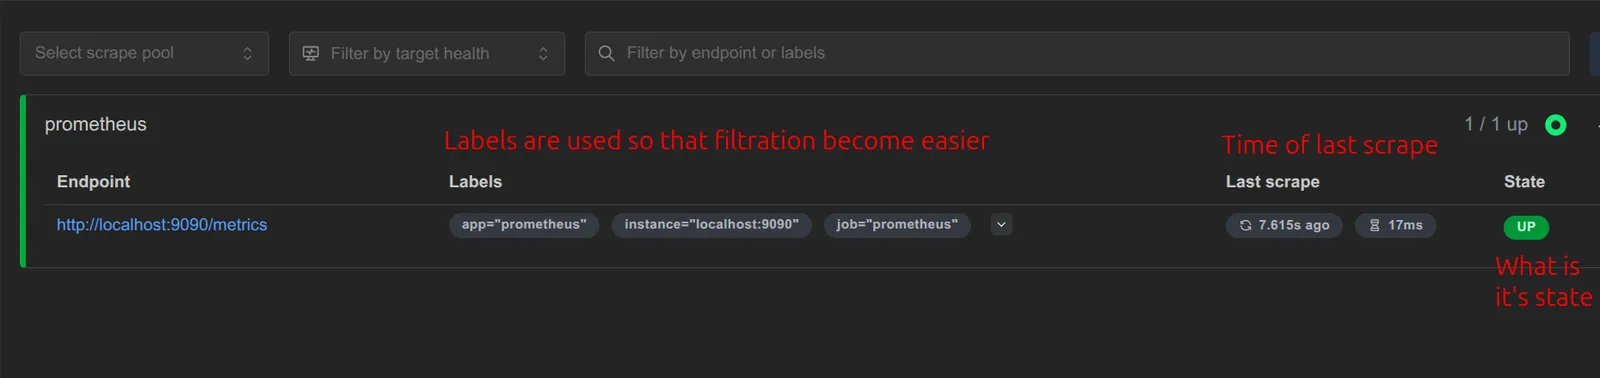
- In target health we can see the status of the targets. By default it is monitoring itself.
Monitoring Rules
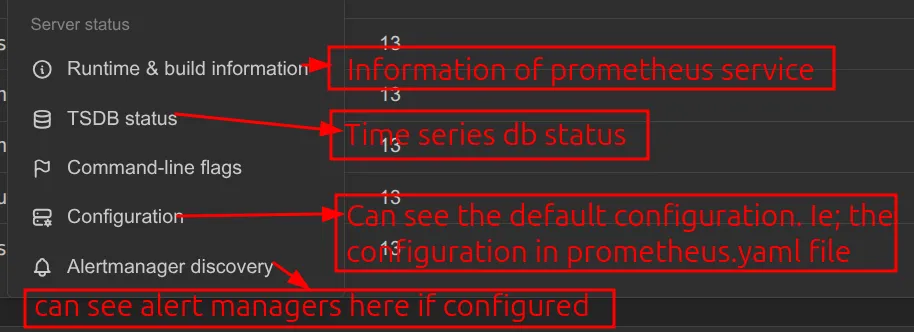
This is the default configuration files in this path that we have copied here using script.

Default prometheus.yml file
# my global config
global:
  scrape_interval: 15s # Set the scrape interval to every 15 seconds. Default is every 1 minute.
  evaluation_interval: 15s # Evaluate rules every 15 seconds. The default is every 1 minute.
  # scrape_timeout is set to the global default (10s).

# Alertmanager configuration
alerting:
  alertmanagers:
    - static_configs:
        - targets:
          # - alertmanager:9093

# Load rules once and periodically evaluate them according to the global 'evaluation_interval'.
rule_files:
  # - "first_rules.yml"
  # - "second_rules.yml"

# A scrape configuration containing exactly one endpoint to scrape:
# Here it's Prometheus itself.
scrape_configs:
  # The job name is added as a label `job=<job_name>` to any timeseries scraped from this config.
  - job_name: "prometheus"

    # metrics_path defaults to '/metrics'
    # scheme defaults to 'http'.

    static_configs:
      - targets: ["localhost:9090"]
       # The label name is added as a label `label_name=<label_value>` to any timeseries scraped from this config.
        labels:
app: "prometheus"- Scrape_configs: Here we configs the what we want to monitor of target machine.
Let’s monitor other parameters of the current machine
Install node exporter
- To get the details of the metrics of current machine we need node exporter. So first we need to install node exporter in our machine. Use this script to install node exporter and change the version accordingly based on your need. For now i am using latest version.
install_nodexporter.sh

#!/bin/bash

EXPORTER_VERSION="v1.9.1"
EXPORTER_FILE="node_exporter-1.9.1.linux-amd64"

wget https://github.com/prometheus/node_exporter/releases/download/"${EXPORTER_VERSION}"/"${EXPORTER_FILE}".tar.gz
tar xvf "${EXPORTER_FILE}".tar.gz
cd "${EXPORTER_FILE}"
sudo cp node_exporter /usr/local/bin

sudo useradd --no-create-home --shell /bin/false node_exporter
sudo chown node_exporter:node_exporter /usr/local/bin/node_exporter
cd -
sudo cp node_exporter.service /etc/systemd/system/node_exporter.service

sudo systemctl daemon-reload
sudo systemctl start node_exporter
sudo systemctl enable node_exporter
sudo systemctl status node_exporter- We have also created a service file for node-exporter so that it will be easier for us to manage.
node_exporter.service


[Unit]
Description=Node Exporter
Wants=network-online.target
After=network-online.target
[Service]
Type=simple
User=node_exporter
Group=node_exporter
ExecStart=/usr/local/bin/node_exporter

[Install]
WantedBy=multi-user.target- Here you can see this output after running systemctl status node_exporter
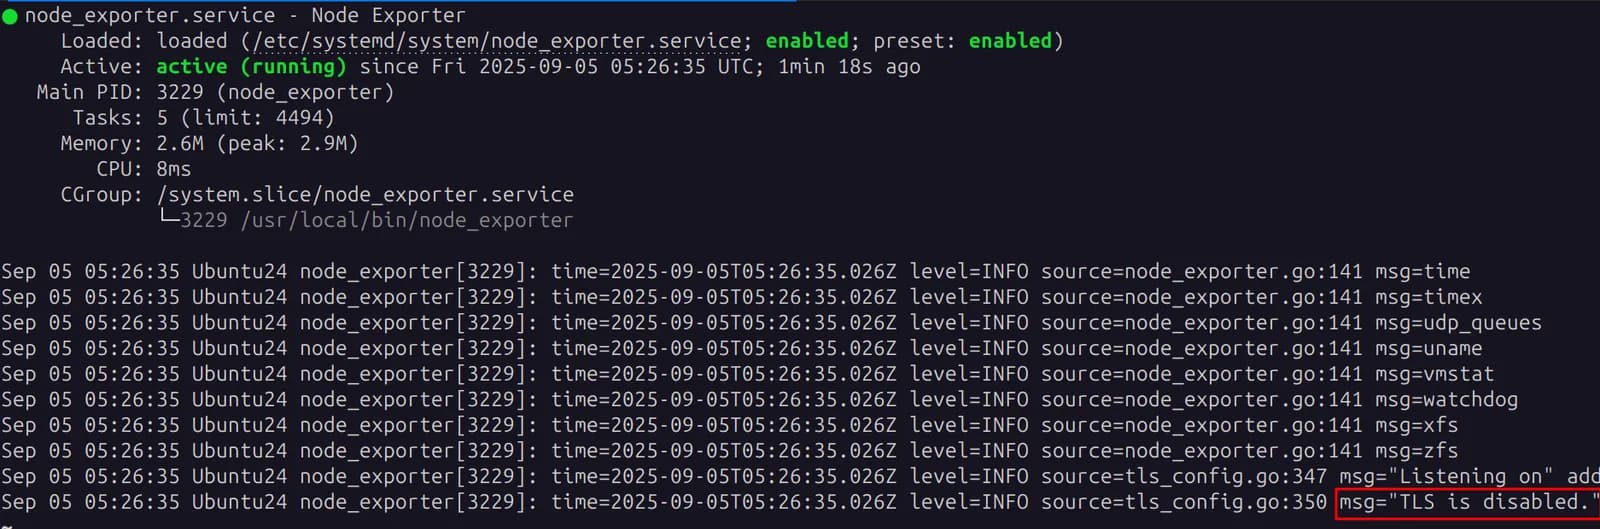
- You can see the msg as TLS is disabled which means this service is not using https:// .This is listening at 9100.
- Now you can access the service using ipaddress_of_vm:port
- 192.168.56.70:9100
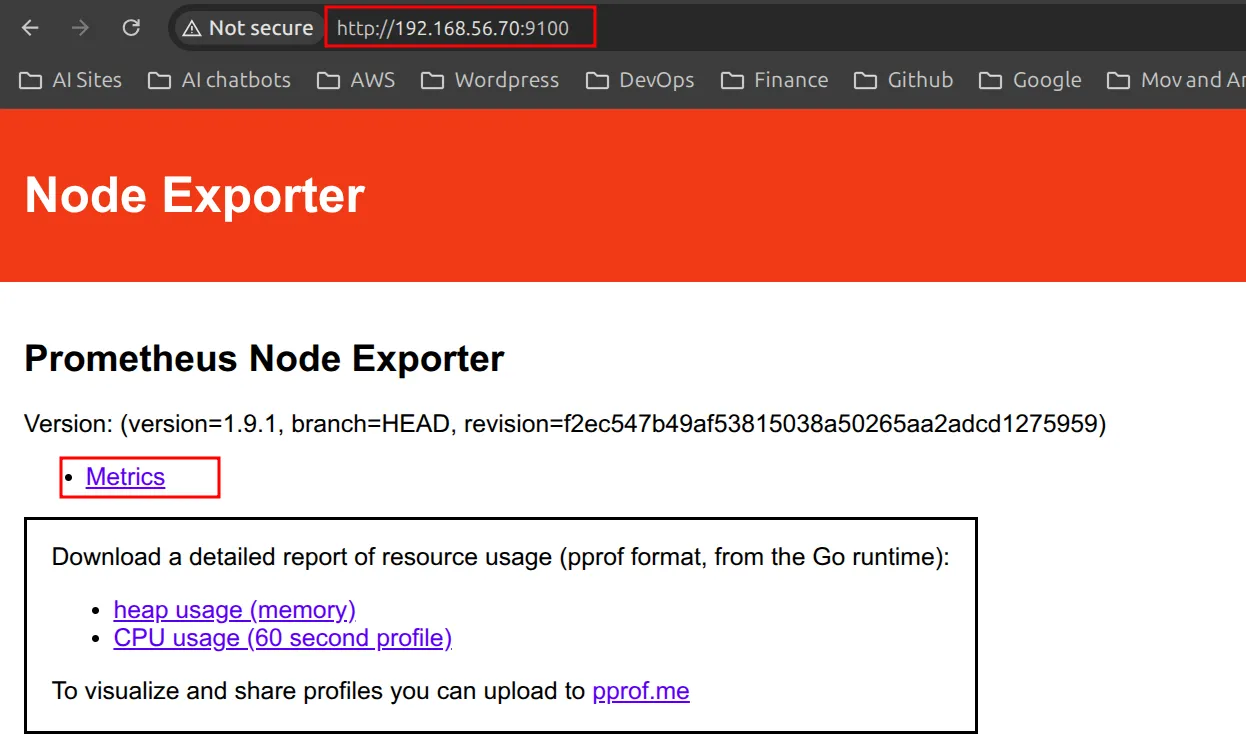
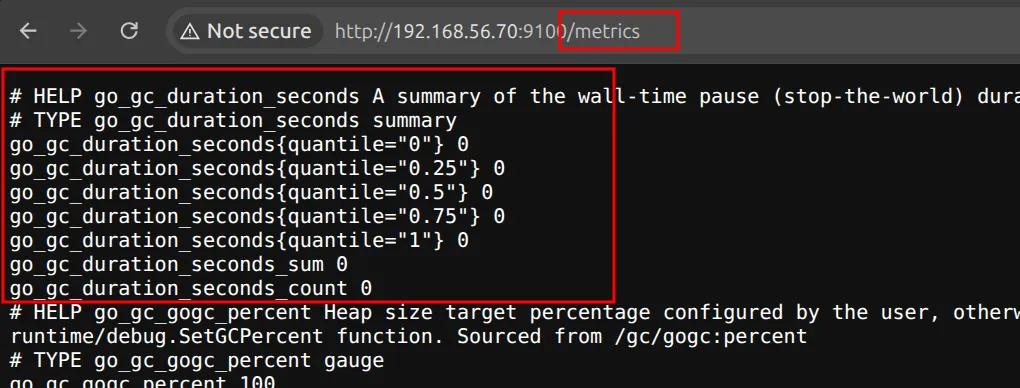
- When you click on metrics you can see the metrics of the machine .
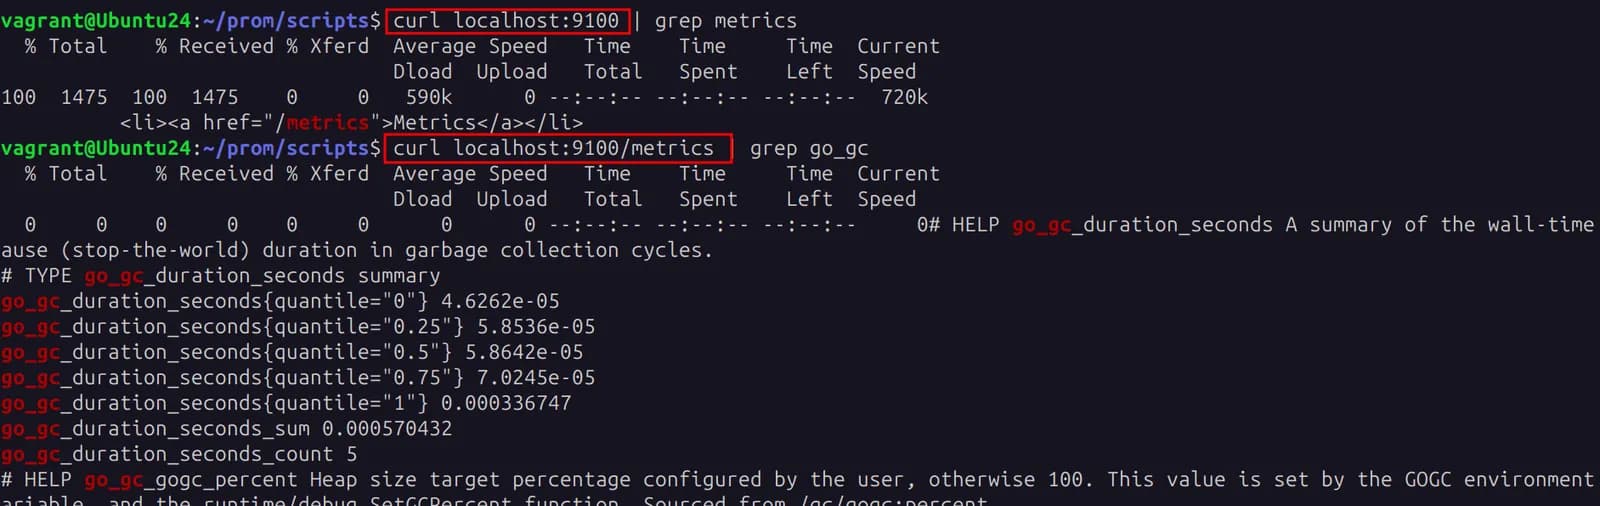
- You can also access node_exporter from terminal using curl localhost:9100 to access node exporter and curl localhost:9100/metrics to see metrics .
Now if we want to collect these metrics values using prometheus we need to modify the prometheus.yaml ie; in /etc/prometheus/prometheus.yaml file.
- Add this job in the default configuration file ie; file
global:
  scrape_interval: 15s
  evaluation_interval: 15s

alerting:
  alertmanagers:
    - static_configs:
        - targets:
          # - alertmanager:9093

rule_files:
scrape_configs:
  - job_name: "prometheus"

    static_configs:
      - targets: ["localhost:9090"]
        labels:
          app: "prometheus"

  - job_name: "PrometheusVM"
    static_configs:
      #node_exporter machine_ip and node_exporter port
      - targets: ["192.168.56.70:9100"]
        labels:
app: "Node_exporter_VM"- We can see the new job that we have configured is successfully showing in screenshot.

- when you click in the http:// link that i have highlighted you will be redirected to the metrics page.
Now let’s monitor another[target] machine metrics
- First create another VMs in you environment.
- If you are configuring these configuration in cloud environment then you need to allow this ip in security group.
- Allow 9100 port in security group.
- If you are configuring these configuration in cloud environment then you need to allow this ip in security group.
- Then you need to install the node_exporter in the target VM as we have done earlier. /link/
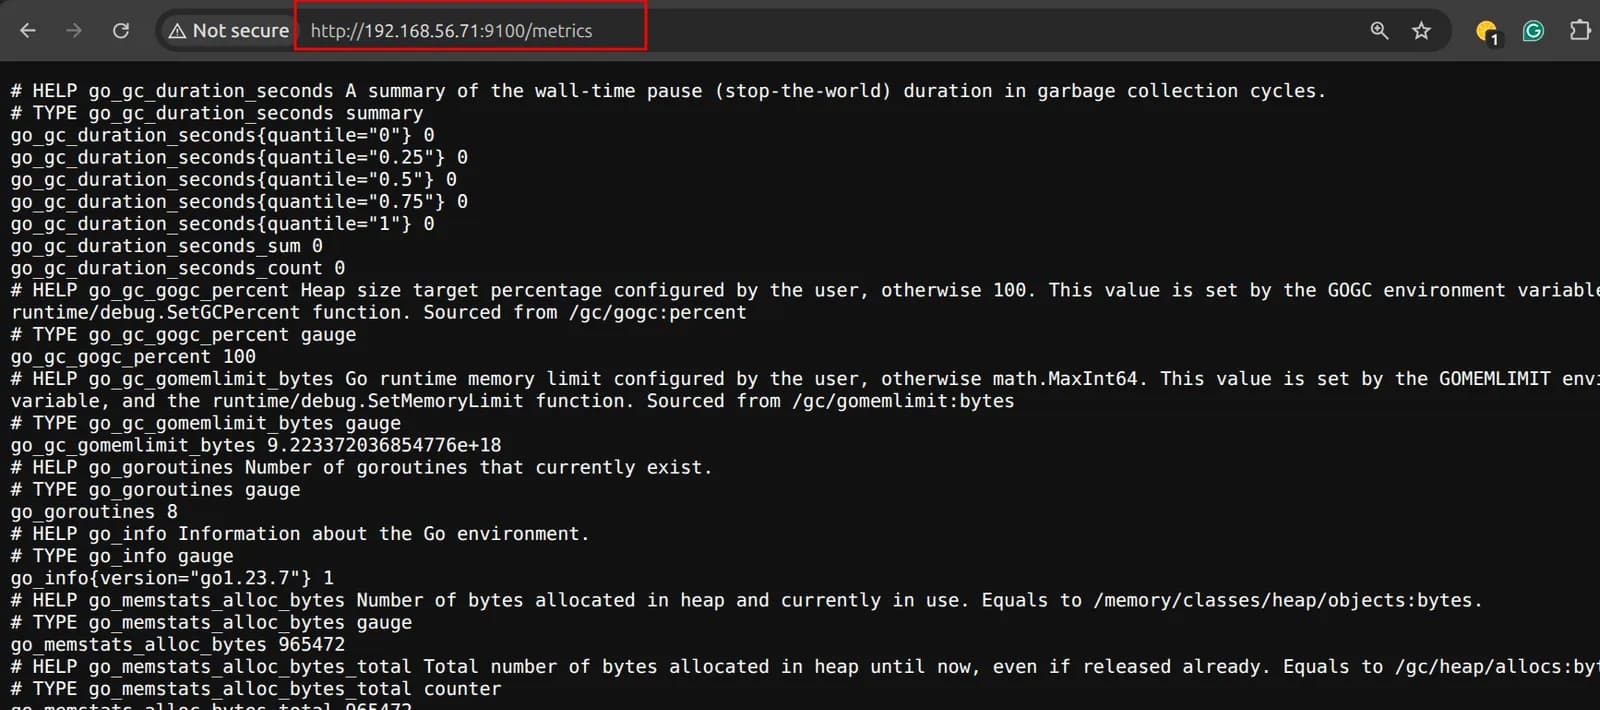
- Now after installing and setting up prometheus you can access that service also by using
- ipaddress_of_vm:port
- 192.168.56.71:9100
- ipaddress_of_vm:port
Now we need to add job in the prometheus .yml file.
global:
  scrape_interval: 15s
  evaluation_interval: 15s

alerting:
  alertmanagers:
    - static_configs:
        - targets:
          # - alertmanager:9093

rule_files:
scrape_configs:
  - job_name: "prometheus"

    static_configs:
      - targets: ["localhost:9090"]
        labels:
          app: "prometheus"


  - job_name: "PrometheusVM"
    static_configs:
      #node_exporter machine_ip and node_exporter port
      - targets: ["192.168.56.70:9100"]
        labels:
          app: "Node_exporter_VM"

  - job_name: "Node_exporter_next_vm"
    static_configs:
      - targets: ["192.168.56.71:9100"]
        labels:
          vm: "Another vm machine"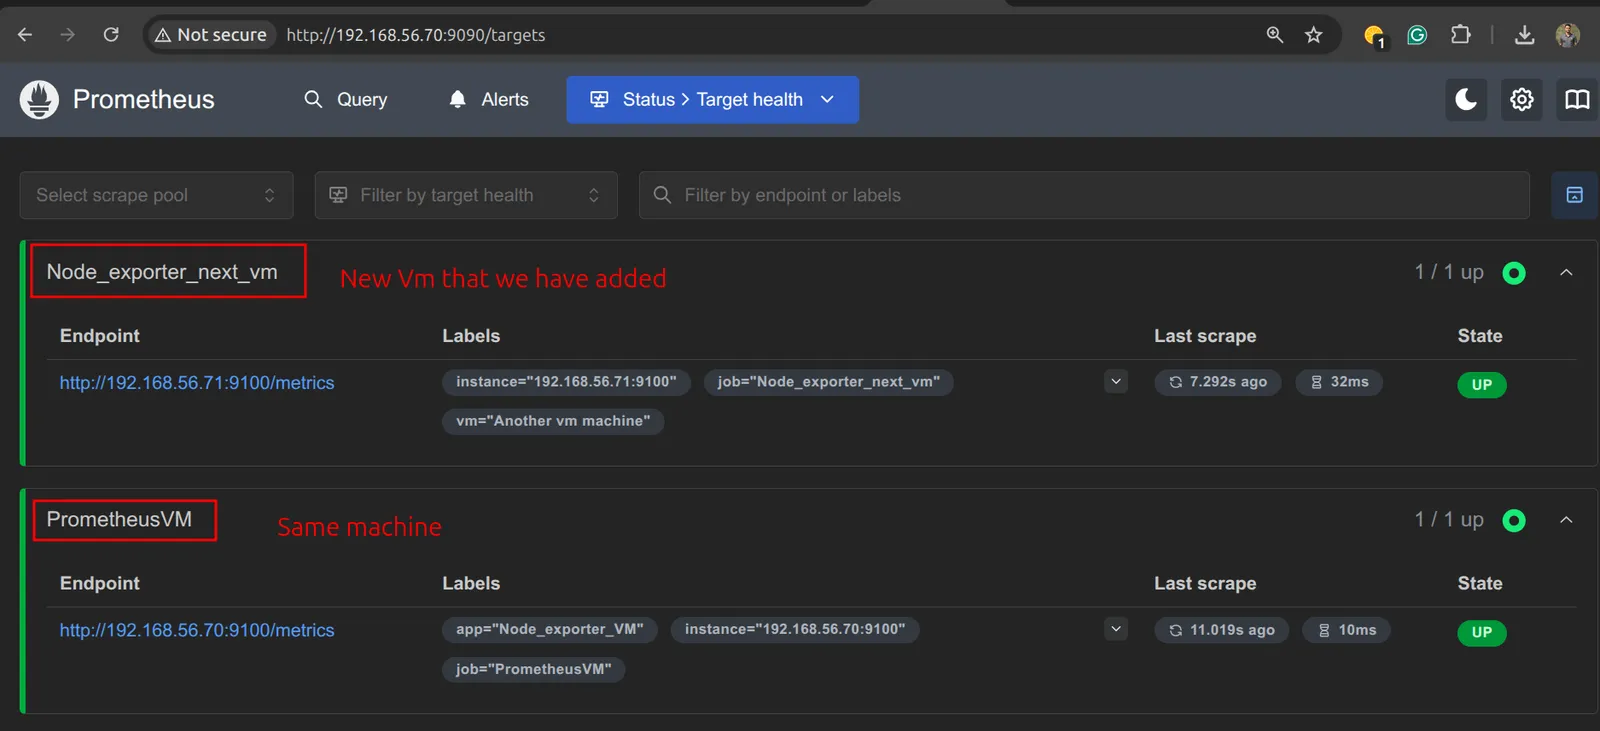
Securing Prometheus API and UI endpoints using basic auth
TLS configuration
“Node export TLS” refers to configuring the Prometheus Node Exporter to use Transport Layer Security (TLS) for secure communication, particularly for encrypting metrics data and enabling client authentication.
TLS configuration Official Doc
To encrypt
You need to generate self signed certificate for testing purpose, But in production we can use CA signed certificate. For now we are generating self signed certificate. We can generate the certificate anywhere in any machine. But we need these files in our machine where we want to establish TLS.
-
cert_file: node_exporter.crt
-
key_file: node_exporter.key
-
Now run this command to generate the certificate files.Make sure you have openssl service running. verify this using command “dpkg -l | grep openssl” For now i am generating this certificates in the source machine where prometheus is running. These certificate should also be in your machine where prometheus is running. If you generate the certificate somewhere else make sure to copy them in your source machine.
openssl req -new -newkey rsa:2048 -days 365 -nodes -x509 \
  -keyout node_exporter.key -out node_exporter.crt \
  -subj "/C=NP/ST=Kathmandu/L=Kirtipur/O=dipendra/CN=localhost" \
-addext "subjectAltName=DNS:localhost"Breakdown
-new -newkey rsa:2048 → create a new 2048-bit RSA key + cert.

-days 365 → valid for 1 year.

-nodes → don’t encrypt private key with a passphrase.

-x509 → generate a self-signed certificate.

-subj "/C=NP/ST=Kathmandu/L=Kirtipur/O=dipendra/CN=localhost" → subject details.

-addext "subjectAltName=DNS:localhost" → adds SAN (important for modern browsers and tools).-
After running this command you will see two files. ie;
node_exporter.crt node_exporter.key -
Now we need to move these files to the target machine also. ie; our another vm that we want to monitor.
-
We can copy these certificates using scp.
scp node_exporter.key vagrant@192.168.56.71:
scp node_exporter.crt vagrant@192.168.56.1:

Here
: This will copy the file in /home/vagrant. If you want to copy to the different path you can mention the path like this.

scp node_exporter.* vagrant@192.56.71:/etc/prometheus/

-- This will copy the both files to /etc/prometheus- NOTE: If you face the permission related issue the change the permission to 755 and after coping revert it to 600.
node_machine configuration
- NOW we create a file named config.yml in the target machine. ie; machine we want to monitor.
config.yml

tls_server_config:
  cert_file: node_exporter.crt
key_file: node_exporter.key- To update the node_exporter process to use this config file in the case of manual run you can use: But we are not using manual method.
- ./node_exporter –web.config.file=config.yml
- But we have configured systemctl so we will be following these steps.
- sudo mkdir /etc/node_exporter
- sudo mv node_exporter.* /etc/node_exporter
- sudo mv config.yml /etc/node_exporter

- Now change the ownership of the files.
- sudo chown -R node_exporter:node_exporter /etc/node_exporter

- Now we need to modify the service file that we have created for node_exporter.
- sudo vim /etc/systemd/system/node_exporter.service
[Unit]
Description=Node Exporter
Wants=network-online.target
After=network-online.target
[Service]
Type=simple
User=node_exporter
Group=node_exporter
ExecStart=/usr/local/bin/node_exporter \
  --web.config.file=/etc/node_exporter/config.yml

[Install]
WantedBy=multi-user.target- Now run these commands
- sudo systemctl daemon-reload
- sudo systemctl restart node_exporter
- Checkt the status
- sudo systemctl status node_explorer
- It should be in running state and now TLS is also enabled.
- sudo systemctl status node_explorer

- The service is running but you will see a TLS handshake error.
- TLS handshake error from 192.168.56.70:46100: client sent an HTTP request to an HTTPS server
- This happens when:
- The server is expecting HTTPS (TLS handshake), here in this case the server is node_exporter
- But the client sent a plain HTTP request instead., client is prometheus server.
- So, the protocols don’t match → TLS handshake fails.
- TLS handshake error from 192.168.56.70:46100: client sent an HTTP request to an HTTPS server
In our case
The error means that the client (node_exporter/Prometheus) is trying to communicate using plain HTTP, but the server is configured to expect HTTPS. Since Prometheus by default listens on HTTP (http://), if we want secure communication, we must configure Prometheus itself with TLS certificates so that it can serve over https://
If you want to access the metrics locally via terminal now you have to use curl -k https://localhost:9100/metrics
Here -k is used to ignore unsafe site message.
without -k you cannot see the metrics.

Here you can see this machine is running in https://
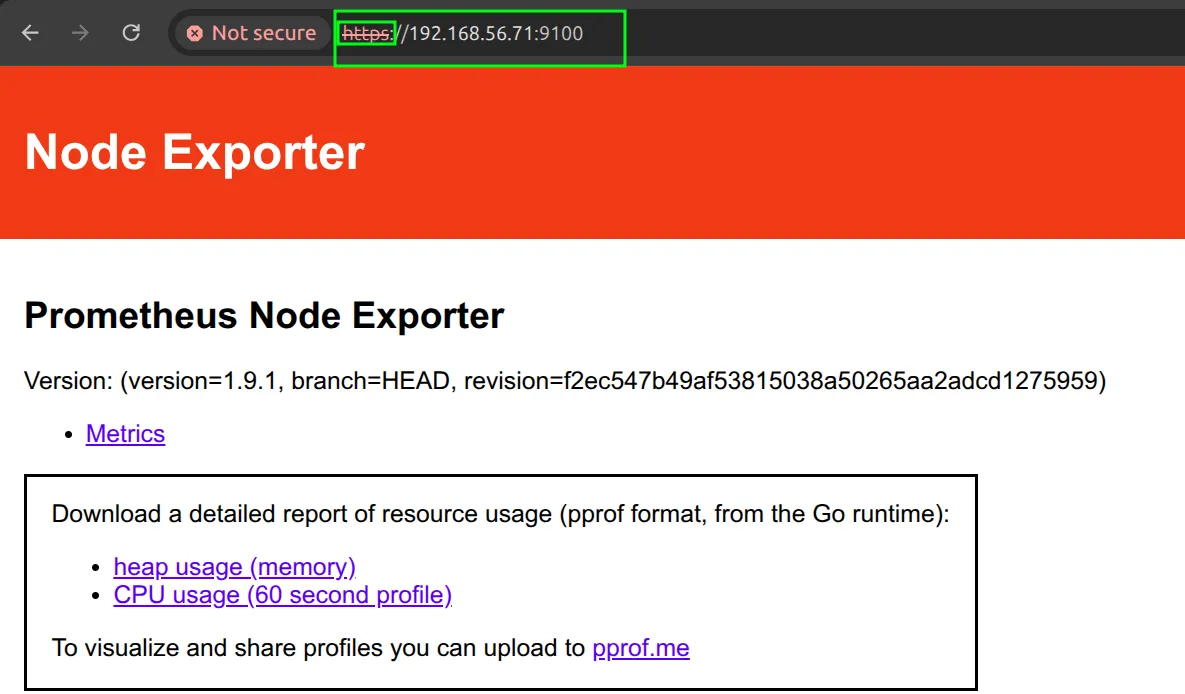
- If we look in the prometheus server we can see the error also.
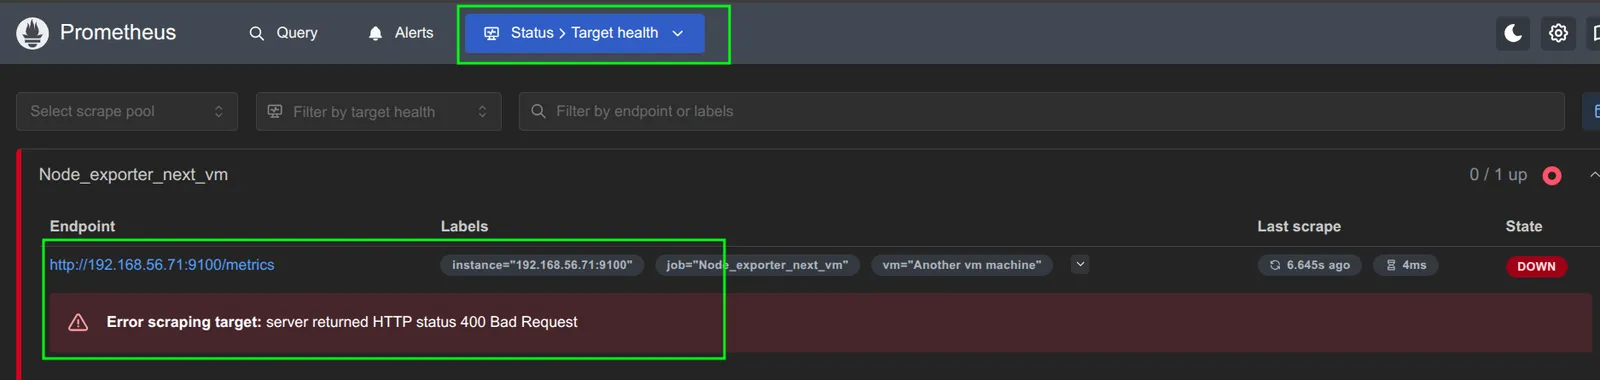
- Now to configure so that it will be able to communicate with the https:// machine. ie; our another_vm/target machine we need to do some configuration in prometheus.yml file in prometheus server.
global:
  scrape_interval: 15s
  evaluation_interval: 15s

alerting:
  alertmanagers:
    - static_configs:
        - targets:
          # - alertmanager:9093

rule_files:
scrape_configs:
  - job_name: "prometheus"

    static_configs:
      - targets: ["localhost:9090"]
        labels:
          app: "prometheus"


  - job_name: "PrometheusVM"
    static_configs:
      #node_exporter machine_ip and node_exporter port
      - targets: ["192.168.56.70:9100"]
        labels:
          app: "Node_exporter_VM"

  - job_name: "Node_exporter_next_vm"
    scheme: https
    tls_config:
      ca_file: /etc/prometheus/node_exporter.crt
      insecure_skip_verify: true
    static_configs:
      - targets: ["192.168.56.71:9100"]
        labels:
vm: "Another vm machine"- Note: The certificate should be in this path as mentioned in tls_config. Now restart the prometheus using systemctl restart prometheus.
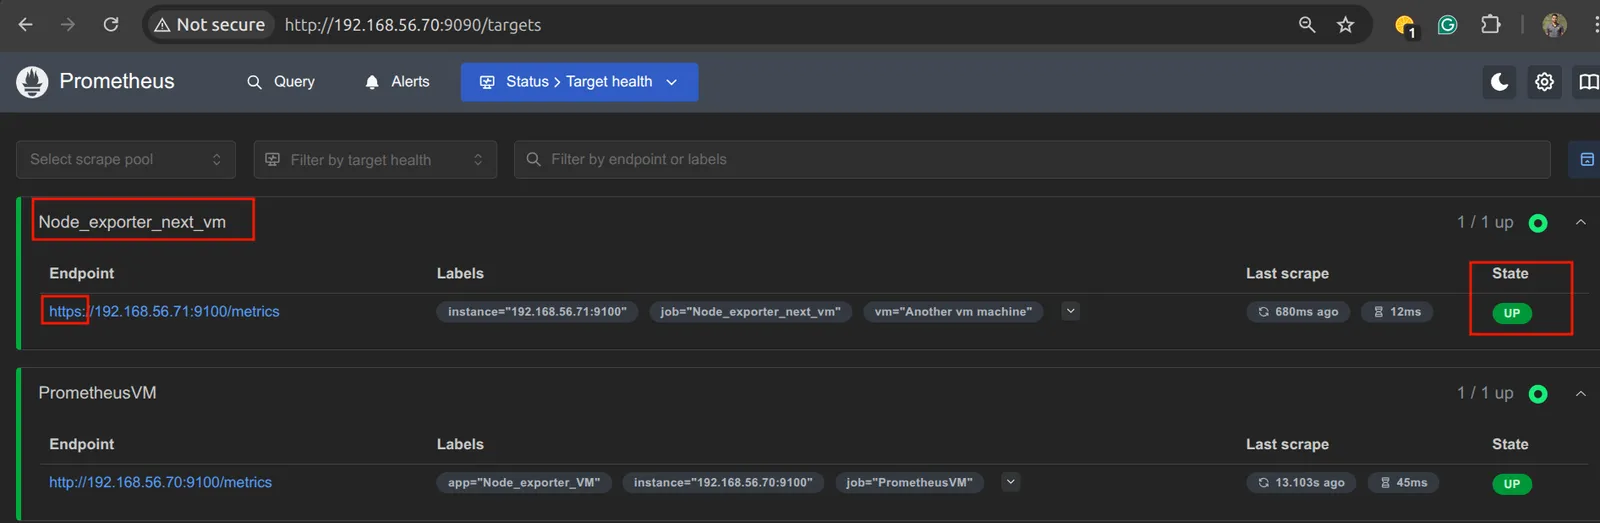
- Now we can access this properly. We have configured TLS upto now but still it is unsecure. Now we need to apply authentication ie; setting username and password if you want to access the metrics.
Prometheus Authentication
- First you need to generate hash password using tools like getpass or bcrypt or apache2-utils or httpd-tools because prometheus don’t allow us to use password in plain format.
- We can create this hash password in any machine. There is no need to create the hash password in the same machine. So for now I am generating in the same machine where prometheus is running but in production you can generate it anywhere.
- For now i am using apache2-utils
- sudo apt install apache2-utils
- Now generate the hash password
- htpasswd -nBC 12 “” | tr -d ‘:\n’

Now we need to go to the node_exporter machine. ie; machine that we are monitoring**/target machine** and the file is in this path: /etc/node_exporter and modify the config.yml file.
tls_server_config:
  cert_file: node_exporter.crt
  key_file: node_exporter.key
basic_auth_users:
dipen: $2y$12$q9I0yLHWLBR81vPXysQ/vuq.tgTawF/GJZTGxOSRjN9Jb3AfJUIuS- Restart the node_exporter
- sudo systemctl restart node_exporter
- Now we can see the unauthorized in prometheus target health section

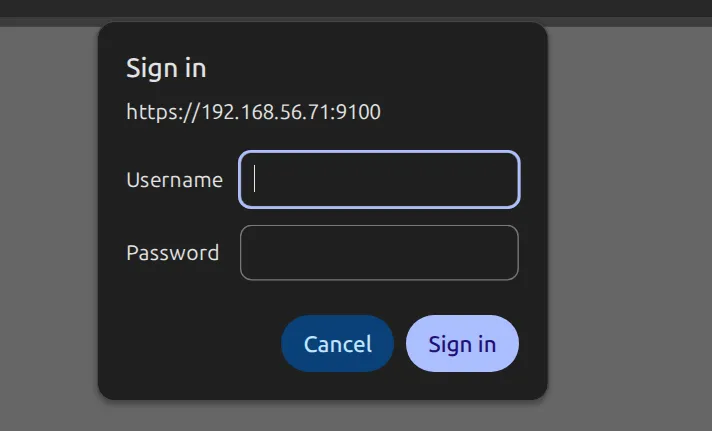
- when we click the link now we have to pass username and password.
-
Now only after providing credentials we can access the metrics. ie;
- username: dipen
- password: test123 >>Here you don’t need to provide hash password.
-
After sometime if you see the status it will be unauthorized or in broken state. So to overcome this we need to add credentials in our prometheus.yml file which is our source machine. ie;
global:
  scrape_interval: 15s
  evaluation_interval: 15s

alerting:
  alertmanagers:
    - static_configs:
        - targets:
          # - alertmanager:9093

rule_files:
scrape_configs:
  - job_name: "prometheus"

    static_configs:
      - targets: ["localhost:9090"]
        labels:
          app: "prometheus"


  - job_name: "PrometheusVM"
    static_configs:
      #node_exporter machine_ip and node_exporter port
      - targets: ["192.168.56.70:9100"]
        labels:
          app: "Node_exporter_VM"

  - job_name: "Node_exporter_next_vm"
    scheme: https
    basic_auth:
      username: dipen
      password: test123
    tls_config:
      ca_file: /etc/prometheus/node_exporter.crt
      insecure_skip_verify: true
    static_configs:
      - targets: ["192.168.56.71:9100"]
        labels:
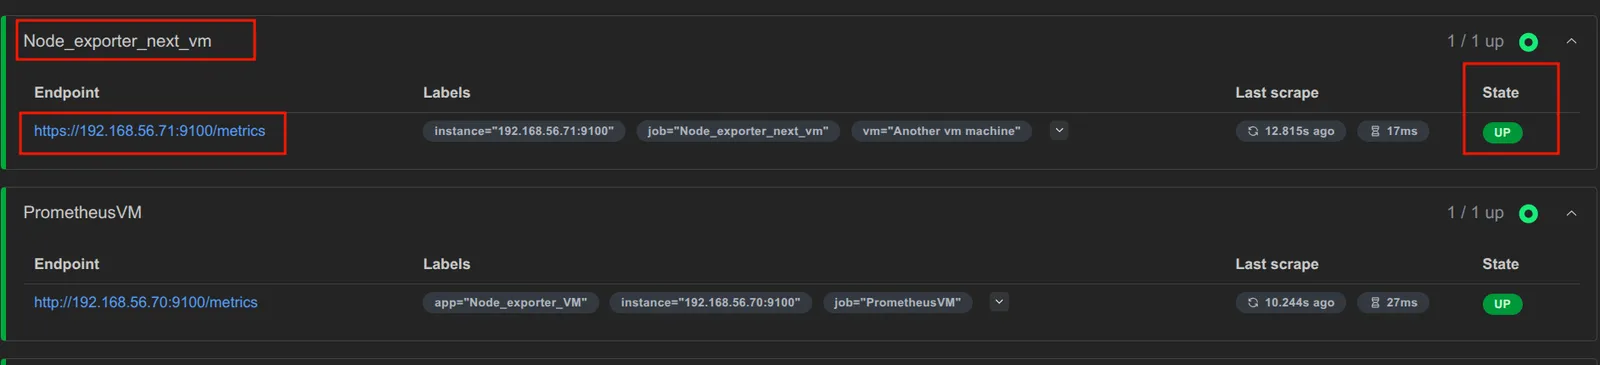
vm: "Another vm machine"- Here now we can see the status is up and can be accessible.
Monitoring Docker containers
Docker engine metrics
- In the case of docker container we cannot directly collect the data by simply installing node_exporter.
- We need to monitor docker engine metrics.
- Container running in the run time.
Metrics can also be scraped from containerized environments, we can collect a couple of things.
- 1. Docker engine metrics
- Cpu used
- memory used
- We can also monitor resources used by frontend container or backend container.
We can monitor docker easily but cannot monitor application container/ docker container.
To monitor docker container we need to install a tool called cAdvisor.
cAdvisor (short for container Advisor) analyzes and exposes resource usage and performance data from running containers. cAdvisor exposes Prometheus metrics out of the box. In this guide, we will:
- create a local multi-container Docker Compose installation that includes containers running Prometheus, cAdvisor, and a Redis server, respectively
- examine some container metrics produced by the Redis container, collected by cAdvisor, and scraped by Prometheus
FOR THIS EXAMPLE I AM INSTALLING docker in the same machine**/target machin**e that we are monitoring earlier and in which we are using node exporter.
- First install docker
- Verify whether it is running or not
- sudo systemctl status docker
- After that create a daemon.json file in the path /etc/docker and and place these lines int that file
- daemon.json
{
  "metrics-addr": "127.0.0.1:9323",
  "experimental": true
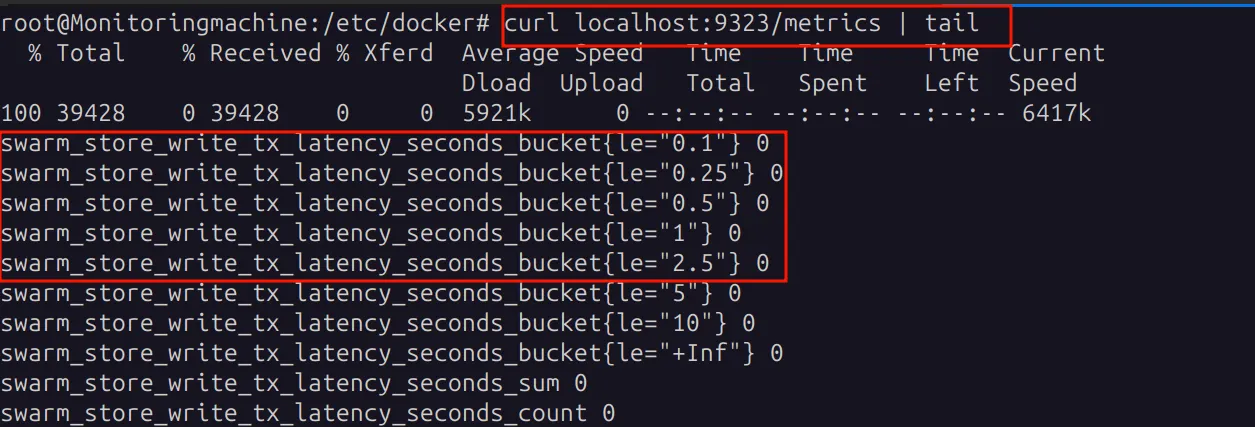
}So now if we run this on the machine we can see the metrics noe.
curl localhost:9323/metrics
Now we need to configure prometheus server and add a job in prometheus.yml file.
global:
  scrape_interval: 15s
  evaluation_interval: 15s

alerting:
  alertmanagers:
    - static_configs:
        - targets:
          # - alertmanager:9093

rule_files:
scrape_configs:
  - job_name: "prometheus"

    static_configs:
      - targets: ["localhost:9090"]
        labels:
          app: "prometheus"


  - job_name: "PrometheusVM"
    static_configs:
      #node_exporter machine_ip and node_exporter port
      - targets: ["192.168.56.70:9100"]
        labels:
          app: "Node_exporter_VM"

  - job_name: "Node_exporter_next_vm"
    scheme: https
    basic_auth:
      username: dipen
      password: test123
    tls_config:
      ca_file: /etc/prometheus/node_exporter.crt
      insecure_skip_verify: true
    static_configs:
      - targets: ["192.168.56.71:9100"]
        labels:
          vm: "Another vm machine"

  - job_name: "Docker_engine"
    static_configs:
- targets: ["192.168.56.71:9323"]To enable cAdvisor we need to run the container to run a cAdvisor process and it is responsible for getting the container specific information.
CAdvisor Metrics
vim docker-compose.yml
services:
  cadvisor:
    image: gcr.io/cadvisor/cadvisor
    container_name: cadvisor
    privileged: true
    devices:
      - "/dev/kmsg:/dev/kmsg"
    volumes:
      - /:/rootfs:ro
      - /var/run:/var/run:ro
      - /var/lib/docker/:/var/lib/docker:ro
      - /dev/disk/:/dev/disk:ro
    ports:
      - 8080:8080
- curl localhost:8080/metrics #Check using this command in terminal
- Now if you access the machine ip with the port now you can see the cadvisor.
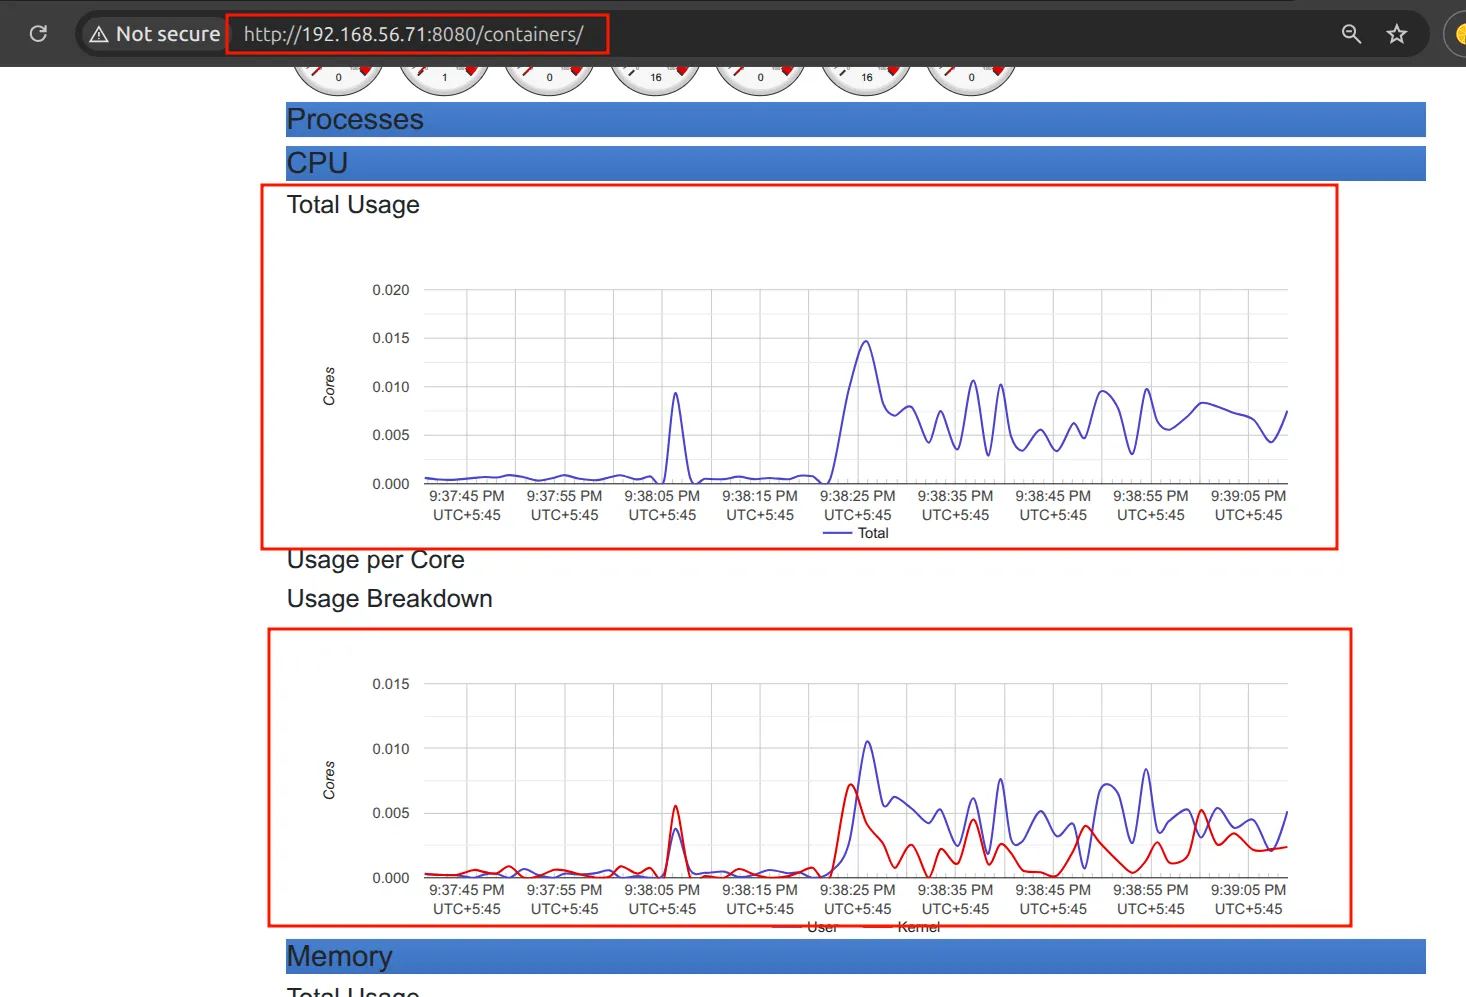
NOW we need to add a new job in prometheus to fetch these details.
global:
  scrape_interval: 15s
  evaluation_interval: 15s

alerting:
  alertmanagers:
    - static_configs:
        - targets:
          # - alertmanager:9093

rule_files:
scrape_configs:
  - job_name: "prometheus"

    static_configs:
      - targets: ["localhost:9090"]
        labels:
          app: "prometheus"


  - job_name: "PrometheusVM"
    static_configs:
      #node_exporter machine_ip and node_exporter port
      - targets: ["192.168.56.70:9100"]
        labels:
          app: "Node_exporter_VM"

  - job_name: "Node_exporter_next_vm"
    scheme: https
    basic_auth:
      username: dipen
      password: test123
    tls_config:
      ca_file: /etc/prometheus/node_exporter.crt
      insecure_skip_verify: true
    static_configs:
      - targets: ["192.168.56.71:9100"]
        labels:
          vm: "Another vm machine"

  - job_name: "Docker_engine"
    static_configs:
      - targets: ["192.168.56.71:9323"]

  - job_name: "cAdvisor"
    static_configs:
- targets: ["192.168.56.71:8080"]After that restart the prometheus service and access in the web you can see ca advisor is listed successfully.

Here when you browse the url you will only see the metrics in plain text not in dashboard. So we need to integrate prometheus with grafana to get visual dashboard.
Docker engine metrics vs cAdvisor Metrics
| Docker engine metrics | cAdvisor Metrics |
|---|---|
| – How much cpu does docker use – Total no of failed image builds – Time to process container actions – No metrics specific to a container | – How much cpu/mem does each container use – No of processes running inside a container – Container uptime – Metrics on a per container basis |
Prometheus Relabeling Configuration Guide
Relabeling in Prometheus allows you to classify and filter targets & metrics by rewriting their label sets. This is essential for customizing how metrics are collected and organized.
Understanding Regular Expressions (Regex)
Before diving into relabeling configurations, it’s important to understand Regular Expressions (Regex) as they are fundamental to how Prometheus matching works.
Regular expressions are patterns used to match character combinations in strings. In Prometheus, regex is used to match label values and extract parts of them.
Basic Regex Patterns
| Pattern | Description | Example | Matches |
|---|---|---|---|
prod | Exact match | prod | Only “prod” |
prod|dev | OR operator | prod|dev | “prod” OR “dev” |
.* | Match any characters | web.* | “web”, “web01”, “webserver” |
Types of Relabeling
- relabel_configs (Before Scraping)
- When: Runs before Prometheus scrapes the target
- What it sees: Only Service Discovery labels (like
__meta_ec2_tag_env,__address__) - What it does:
- Decides which targets to scrape (
keep/drop) - Modifies target information (like changing scrape URLs)
- Adds labels that will appear on ALL metrics from this target
- Decides which targets to scrape (
- Example: Filter EC2 instances by environment tag before scraping them.
- metric_relabel_configs (After Scraping)
- When: Runs after Prometheus scrapes the target and gets metrics
- What it sees: All the actual metric labels from the scraped application
- What it does:
- Modifies individual metric labels
- Drops specific metrics you don’t want to store
- Renames metric labels
- Example: Remove sensitive labels from metrics or drop high-cardinality metrics.
Key Difference
**relabel_configs**= “Should I scrape this target? How should I scrape it?”**metric_relabel_configs**= “What should I do with these metrics I just scraped?”
Common Relabeling Actions
- Keep Action
- Scrape targets only if they match the specified criteria.
scrape_configs:
  - job_name: example
    relabel_configs:
      - source_labels: [__meta_ec2_tag_env]
        regex: prod
action: keepResult: Only EC2 instances with env=prod tag will be scraped.
- Drop Action
- Exclude targets that match the specified criteria.
scrape_configs:
  - job_name: example
    relabel_configs:
      - source_labels: [__meta_ec2_tag_env]
        regex: dev
action: dropResult: EC2 instances with env=dev tag will NOT be scraped.
- Replace Action
- Create new labels or modify existing ones using regex capture groups.
scrape_configs:
  - job_name: example
    relabel_configs:
      - source_labels: [__address__]
        regex: (.*):.*
        target_label: ip
        action: replace
replacement: $1- Example:
- Input:
__address__=192.168.1.1:80 - Output:
ip=192.168.1.1
- Input:
Working with Multiple Labels
- Using Multiple Source Labels
- When multiple
source_labelsare specified, they are joined by a semicolon (;) by default.
- When multiple
scrape_configs:
  - job_name: example
    relabel_configs:
      - source_labels: [env, team]
        regex: dev;marketing
action: keepResult: Keeps targets where env=dev AND team=marketing.
- Custom Separator
- Change the default separator using the
separatorproperty.
- Change the default separator using the
scrape_configs:
  - job_name: example
    relabel_configs:
      - source_labels: [env, team]
        regex: dev-marketing
        action: keep
separator: "-"Label Management Actions
- Label Drop
- Remove specific labels from the final label set.
scrape_configs:
  - job_name: example
    relabel_configs:
      - regex: __meta_ec2_owner_id
action: labeldropResult: The __meta_ec2_owner_id label will be removed.
- Label Keep
- Keep only specified labels and drop all others.
scrape_configs:
  - job_name: example
    relabel_configs:
      - regex: instance|job
action: labelkeepResult: Only instance and job labels are kept; all others are dropped.
- Label Map
- Transform label names using regex patterns.
scrape_configs:
  - job_name: example
    relabel_configs:
      - regex: __meta_ec2_tag_(.+)
        action: labelmap
replacement: ec2_${1}Key Properties Reference
| Property | Description | Example |
|---|---|---|
source_labels | Array of labels to match against | [__meta_ec2_tag_env] |
regex | Regular expression to match label values | prod or (.*):.* |
action | Action to perform | keep, drop, replace, labeldrop, labelkeep |
target_label | Name of the new/modified label | ip, environment |
replacement | New value for the label | $1, production |
separator | Character to join multiple source labels | -, _, ; (default) |
Remember to reload Prometheus configuration after making changes!
Prometheus Push Gateway Setup Guide
Batch jobs only run for a short period of time and then exit which makes it difficult for Prometheus to scrape. Push Gateway acts as the middleman between the batch job and the Prometheus server. The batch job would run and when it’s complete, it pushes metrics to push the gateway before exiting. Now the push gateway has all the metrics stored in there. Prometheus scrape metrics at regular interval.
Installing Push Gateway
#!/bin/bash

# Variables
GATEWAY_VERSION="v1.11.1"
GATEWAY_FILE="pushgateway-1.11.1.linux-amd64"

# Download and install
wget https://github.com/prometheus/pushgateway/releases/download/"${GATEWAY_VERSION}"/"${GATEWAY_FILE}".tar.gz
tar xvf "${GATEWAY_FILE}".tar.gz
cd "${GATEWAY_FILE}"
./pushgateway
sudo useradd --no-create-home --shell /bin/false pushgateway
sudo cp pushgateway /usr/local/bin
sudo chown pushgateway:pushgateway /usr/local/bin/pushgateway
cd -
sudo cp pushgateway.service /etc/systemd/system/pushgateway.service
sudo systemctl daemon-reload
sudo systemctl start pushgateway
sudo systemctl enable pushgateway
sudo systemctl status pushgatewayCreate Systemd Service
sudo vim /etc/systemd/system/pushgateway.service
and Add the following content:
[Unit]
Description=Prometheus Pushgateway
Wants=network-online.target
After=network-online.target

[Service]
User=pushgateway
Group=pushgateway
Type=simple
ExecStart=/usr/local/bin/pushgateway

[Install]
WantedBy=multi-user.target- Start and Enable Service
- sudo systemctl daemon-reload
- sudo systemctl restart pushgateway
- sudo systemctl enable pushgateway
- sudo systemctl status pushgateway
- curl localhost:9091/metrics
Configure Prometheus
- Configure prometheus to scrape the pushgateway:
- vim /etc/prometheus/prometheus.yml
scrape_configs:
  - job_name: pushgateway
    honor_labels: true
    static_configs:
- targets: ["192.168.1.151:9091"]Pushing Metrics to Push Gateway
Metrics can be pushed to the pushgateway using one of the following:
1. Send HTTP Requests to Push Gateway
You can send metrics directly using HTTP POST/PUT requests to the Push Gateway API endpoint.
Example:
echo "my_batch_job_duration_seconds 45.2" | curl --data-binary @- \
http://localhost:9091/metrics/job/my_batch_job/instance/server12. Prometheus Client Libraries
Client libraries are programming packages (available for Python, Java, Go, Node.js, etc.) that make it super easy to create and push metrics from your code – instead of manually crafting HTTP requests, you just write simple code like job_duration.set(45.2) and push_to_gateway(), and the library handles all the formatting and communication with Push Gateway automatically, making your batch job code much cleaner and less error-prone.
Python Example:
from prometheus_client import CollectorRegistry, Gauge, push_to_gateway

registry = CollectorRegistry()
job_duration = Gauge('batch_job_duration_seconds', 'Job duration', registry=registry)
job_duration.set(45.2)
push_to_gateway('localhost:9091', job='my_batch_job', registry=registry)NEXT DOCUMENT
Keep reading
- Prometheus II
Alert Manager The prometheus generates alert for you but it cannot send notification to yo via email, slack, teams, etc. So for this we need to configure alert manager. Prometheus allows you to…
- Amazon S3
Amazon Simple Storage Service (Amazon S3) is an object storage service that offers industry-leading scalability, data availability, security, and performance. Customers of all sizes and industries…
- KUbernetes
Introduction kubernetes is similar to docker swarm. Kubernetes is also a container orchestration tool. We can run kubernetes in every environment example laptop, dev, production, cloud. So if there…