Prometheus Setup: node_exporter, TLS, Docker and Relabeling
Install Prometheus and node_exporter as systemd services, scrape a second VM over TLS with basic auth, monitor Docker with cAdvisor, and apply relabeling and the Pushgateway.

ON THIS PAGE
A monitoring stack is only useful if its scrapes are reliable and its metrics are not readable by anyone on the network. This guide builds a Prometheus lab from scratch on two Ubuntu VMs: Prometheus and node_exporter run as systemd services, the scrape of a second machine is secured with TLS and basic auth, and Docker is covered with engine metrics and cAdvisor. It closes with relabeling, the Pushgateway, and a reference of the errors that turn a target red.
Prerequisites
- Two Ubuntu VMs that can reach each other. This lab uses Vagrant, with Prometheus on
192.168.56.70and the monitored machine on192.168.56.71. sudoaccess on both VMs.- Docker with the Compose plugin on the monitored VM, for the Docker section.
Observability in one page
Observability is the ability to understand what happens inside a system from the data it emits. That data falls into three pillars:
| Pillar | What it is | Example |
|---|---|---|
| Metrics | Numbers measured over time | CPU usage, memory, request latency, error rate (5 errors per 1000 requests = 0.5%) |
| Logs | Text records of events, with a timestamp and source | "payment service timed out at 2:35 AM" |
| Traces | The path of one request across services | frontend → backend → database → external API, with the time spent in each hop |
Monitoring vs observability. Monitoring watches known signals against fixed rules ("alert if disk > 95%") and reports that something is wrong. Observability combines metrics, logs and traces to answer questions nobody planned for, such as why latency is high only for users in Europe. Monitoring is part of observability, and Prometheus covers the metrics pillar.
Three reliability terms appear with every monitoring tool:
| Term | Meaning | Example |
|---|---|---|
| SLI (Service Level Indicator) | The metric you measure | Error rate = 0.15% |
| SLO (Service Level Objective) | Your internal target for that metric. Never 100% | Error rate < 0.1% over 30 days |
| SLA (Service Level Agreement) | A contract with a penalty if the SLO is missed | "If error rate > 0.1%, you get a credit" |
What Prometheus is
Prometheus is an open-source monitoring and alerting toolkit. It started at SoundCloud in 2012 and was the second project to join the Cloud Native Computing Foundation (CNCF), after Kubernetes. Its defining features:
-
Multi-dimensional data model. Every time series is a metric name plus key/value labels. One metric covers many cases:
TXTPlain texthttp_requests_total{method="GET", endpoint="/api/users", status="200"} 1547 http_requests_total{method="POST", endpoint="/api/orders", status="500"} 23 -
PromQL, a query language that filters and aggregates by those labels.
-
Pull model over HTTP. Prometheus scrapes each target's
/metricsendpoint on an interval (15 seconds in the default config). -
Single, independent servers. Each server stores data in its own local time series database (TSDB), with no distributed storage to operate.
-
Pushgateway for short-lived jobs that end before they can be scraped.
-
Static config or service discovery (Kubernetes, AWS EC2, Consul, DNS) to find targets.
Prometheus fits numeric, machine-centric monitoring in dynamic environments. It is the wrong tool when every individual event matters, such as per-request billing or audit trails, because it samples on an interval. It also does not store logs or traces.
Metric types
| Type | Behaviour | Real example from Prometheus itself |
|---|---|---|
| Counter | Only goes up (resets on restart) | prometheus_http_requests_total |
| Gauge | Goes up and down | prometheus_tsdb_head_memory_usage_bytes, up (1 = reachable, 0 = not) |
| Histogram | Counts observations in buckets (under 0.1s, under 0.5s...) | prometheus_http_request_duration_seconds |
| Summary | Like a histogram but reports quantiles (50th, 90th, 99th) | prometheus_rule_evaluation_duration_seconds |
The ecosystem
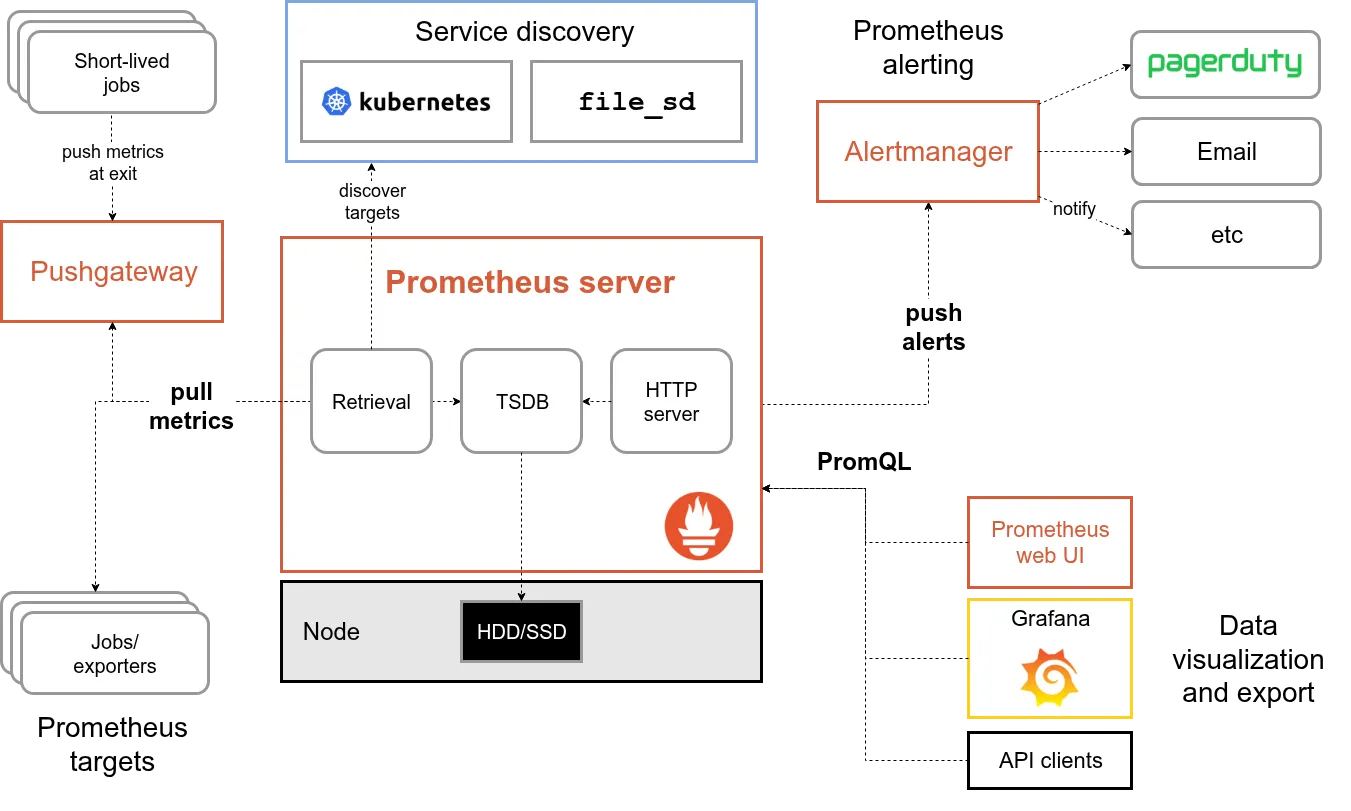
The architecture diagram in the cover image shows how the components connect:
| Component | Job |
|---|---|
| Prometheus server | Discovers targets, scrapes them, stores samples in the TSDB, answers PromQL queries |
| Exporters | Expose metrics for systems you cannot change. Node Exporter (CPU, memory, disk), Blackbox Exporter (HTTP probes), database and Nginx/HAProxy exporters |
| Client libraries | Code you add to your own app (Go, Java, Python...) to expose /metrics |
| Pushgateway | Holds metrics pushed by short-lived jobs so Prometheus can scrape them |
| Alertmanager | Receives alerts from Prometheus, groups and routes them, sends email, Slack or PagerDuty notifications. Prometheus cannot send notifications on its own |
| Grafana | Dashboards on top of PromQL. The built-in web UI is only for quick queries |
Install Prometheus by hand
Prometheus also runs as the prom/prometheus Docker image, with a volume mounted for the config and data. This lab installs the binary from the download page. For production, pick the release marked LTS; at the time of writing that was 3.5.0.
$ wget https://github.com/prometheus/prometheus/releases/download/v3.5.0/prometheus-3.5.0.linux-amd64.tar.gz
$ tar xzvf prometheus-3.5.0.linux-amd64.tar.gz
$ cd prometheus-3.5.0.linux-amd64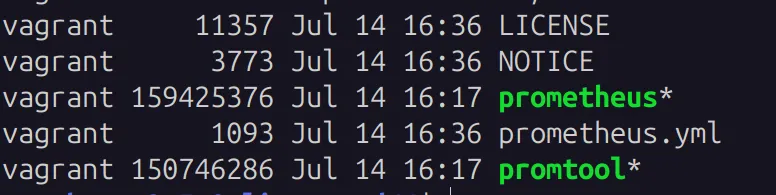
| File | Purpose |
|---|---|
prometheus | The server binary |
prometheus.yml | The main config file. Every target you add goes here |
promtool | Helper to check config and rule files (promtool check config) and run test queries |
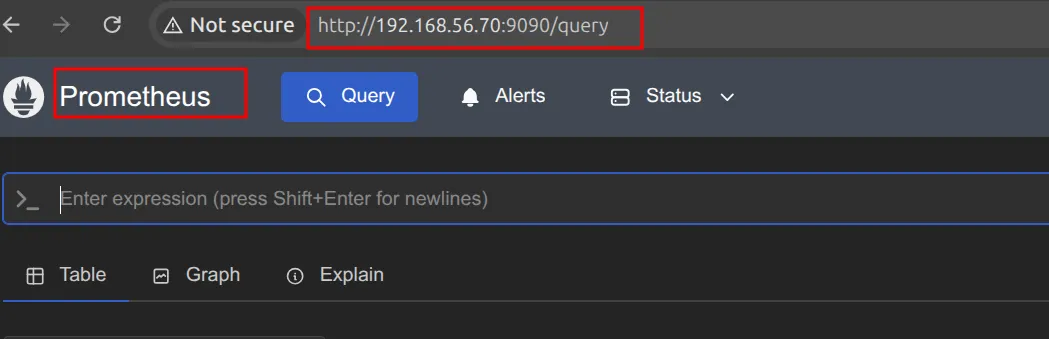
Start the server in the foreground with ./prometheus, or in the background with ./prometheus &. The UI listens on port 9090:
A manual start has no clean way to stop or restart the process; you must find its process ID and kill it.
$ ps aux | grep prometheus
$ sudo kill 1725
It also does not survive a reboot, so the next step is to run Prometheus as a systemd service.
Install Prometheus as a systemd service
The script below creates a system user with no login shell, installs the binaries in /usr/local/bin, the config in /etc/prometheus and the data in /var/lib/prometheus, then installs the unit file. For more on unit files, see running Tomcat as a systemd service.
#!/bin/bash
# Change the version after checking https://prometheus.io/download/
PROMETHEUS_VERSION="v3.5.0"
PROMETHEUS_FILE="prometheus-3.5.0.linux-amd64"

# System user that only runs the service
sudo useradd --no-create-home --shell /bin/false prometheus

# Config and data directories
sudo mkdir /etc/prometheus
sudo mkdir /var/lib/prometheus
sudo chown prometheus:prometheus /etc/prometheus
sudo chown prometheus:prometheus /var/lib/prometheus

# Download and extract
wget https://github.com/prometheus/prometheus/releases/download/"${PROMETHEUS_VERSION}"/"${PROMETHEUS_FILE}".tar.gz
tar xvf "${PROMETHEUS_FILE}".tar.gz
cd "${PROMETHEUS_FILE}"

# Binaries, owned by the service user
sudo cp prometheus /usr/local/bin/
sudo cp promtool /usr/local/bin/
sudo chown prometheus:prometheus /usr/local/bin/prometheus
sudo chown prometheus:prometheus /usr/local/bin/promtool

# Default config
sudo cp prometheus.yml /etc/prometheus/prometheus.yml
sudo chown prometheus:prometheus /etc/prometheus/prometheus.yml
cd -

# Unit file (shown below), then start the service
sudo cp prometheus.service /etc/systemd/system/prometheus.service
sudo systemctl daemon-reload
sudo systemctl start prometheus
sudo systemctl enable prometheus
sudo systemctl status prometheus[Unit]
Description=Prometheus
Wants=network-online.target
After=network-online.target
[Service]
User=prometheus
Group=prometheus
Type=simple
ExecStart=/usr/local/bin/prometheus \
--config.file /etc/prometheus/prometheus.yml \
--storage.tsdb.path /var/lib/prometheus/
[Install]
WantedBy=multi-user.target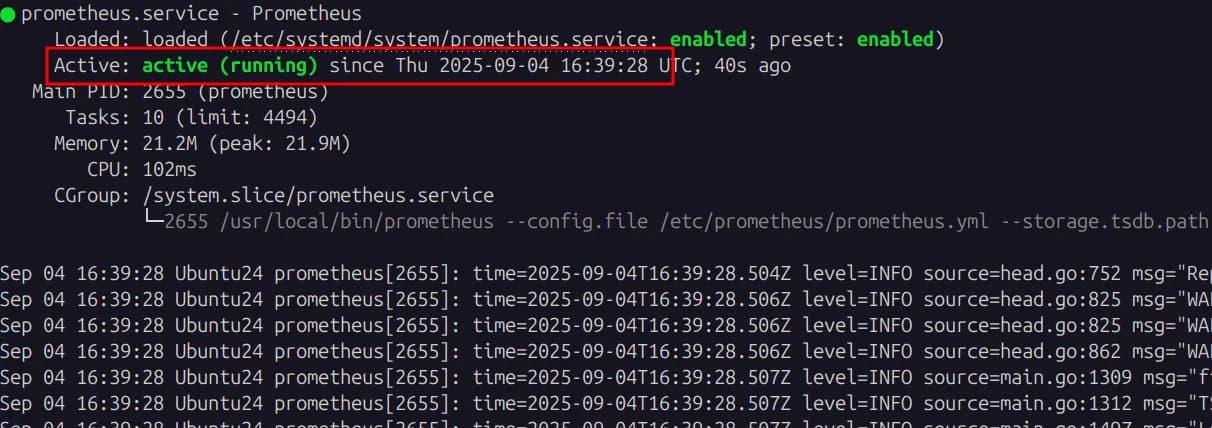
Prometheus is now managed with systemctl, and the UI is at http://<ip_address>:9090.
A quick tour of the UI
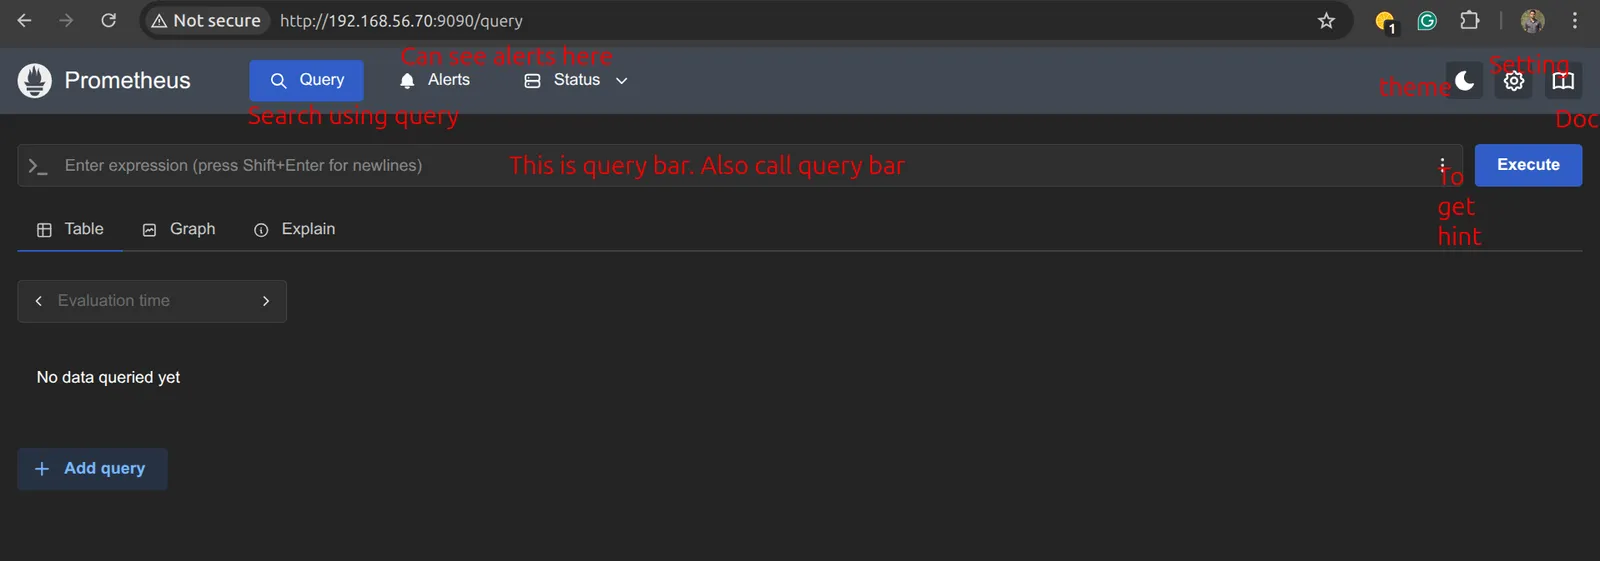
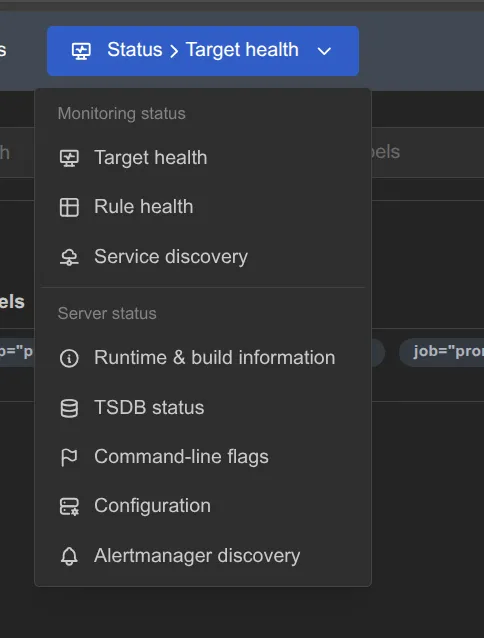
The Status menu holds most of the pages needed during setup:
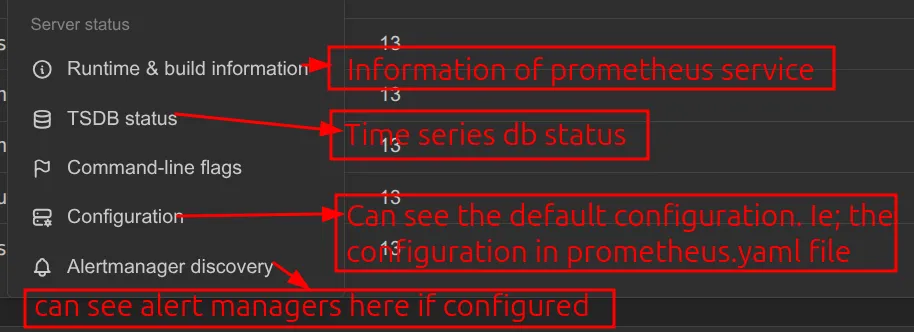
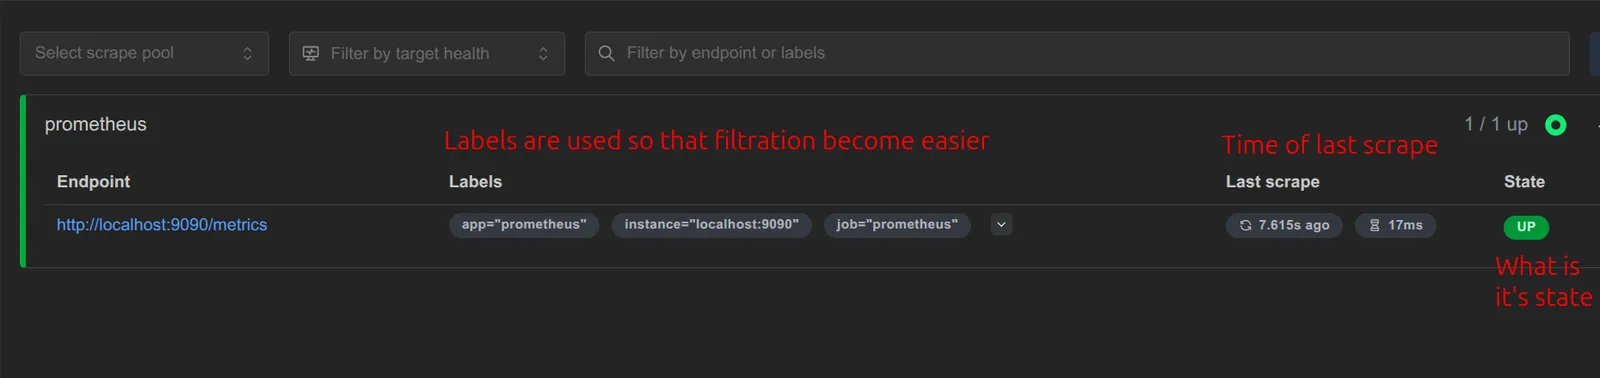
Status → Configuration shows the config Prometheus loaded, the first page to check when a change does not take effect. Target health lists every scrape target. Out of the box, Prometheus scrapes only itself:
The prometheus.yml file
The script copied the default config to /etc/prometheus/prometheus.yml:
global:
  scrape_interval: 15s     # scrape every 15 seconds (the built-in default is 1 minute)
  evaluation_interval: 15s # evaluate rules every 15 seconds (default 1 minute)
  # scrape_timeout defaults to 10s

alerting:
  alertmanagers:
    - static_configs:
        - targets:
          # - alertmanager:9093

rule_files:
  # - "first_rules.yml"

scrape_configs:
  # job_name is added as the label job="<job_name>" to every series from this job
  - job_name: "prometheus"
    # metrics_path defaults to /metrics, scheme defaults to http
    static_configs:
      - targets: ["localhost:9090"]
        labels:
app: "prometheus"Every target belongs in scrape_configs. Each job has a name, a list of host:port targets and optional labels, which make filtering easier later.
Monitor the Prometheus host with node_exporter
Prometheus does not collect CPU, memory or disk stats itself; node_exporter exposes them on port 9100. Install it with a similar script (version 1.9.1 from the download page):
#!/bin/bash
EXPORTER_VERSION="v1.9.1"
EXPORTER_FILE="node_exporter-1.9.1.linux-amd64"

wget https://github.com/prometheus/node_exporter/releases/download/"${EXPORTER_VERSION}"/"${EXPORTER_FILE}".tar.gz
tar xvf "${EXPORTER_FILE}".tar.gz
cd "${EXPORTER_FILE}"
sudo cp node_exporter /usr/local/bin

sudo useradd --no-create-home --shell /bin/false node_exporter
sudo chown node_exporter:node_exporter /usr/local/bin/node_exporter
cd -
sudo cp node_exporter.service /etc/systemd/system/node_exporter.service

sudo systemctl daemon-reload
sudo systemctl start node_exporter
sudo systemctl enable node_exporter
sudo systemctl status node_exporter[Unit]
Description=Node Exporter
Wants=network-online.target
After=network-online.target
[Service]
Type=simple
User=node_exporter
Group=node_exporter
ExecStart=/usr/local/bin/node_exporter
[Install]
WantedBy=multi-user.target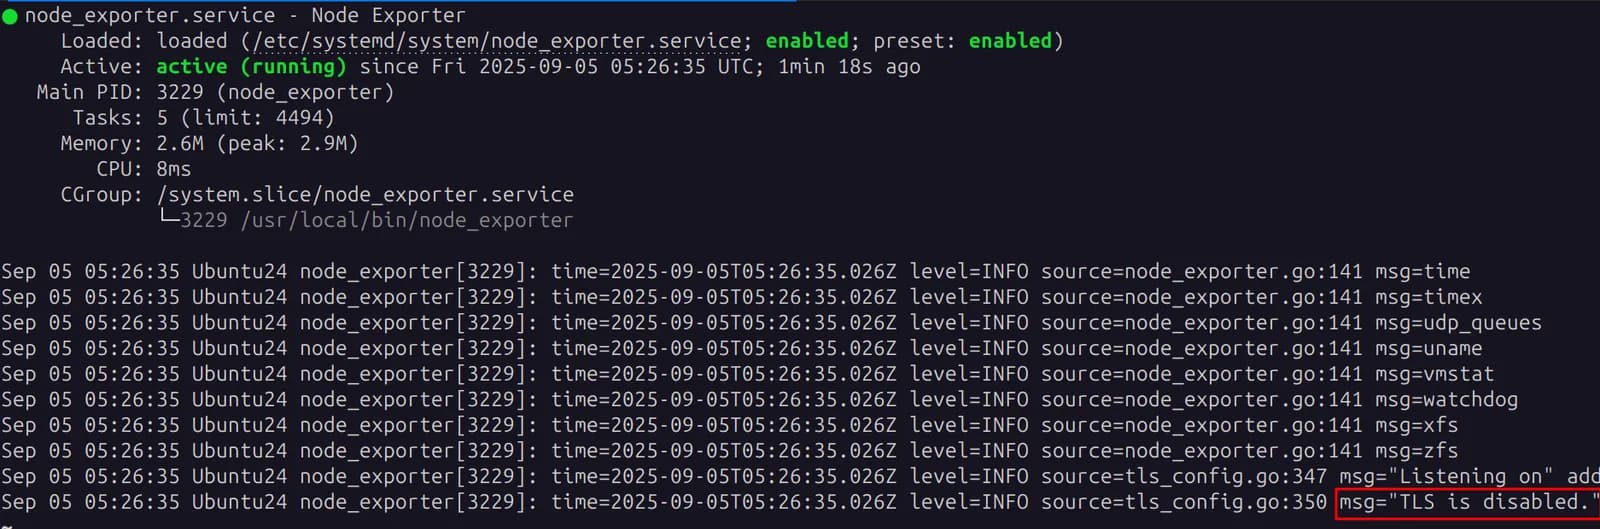
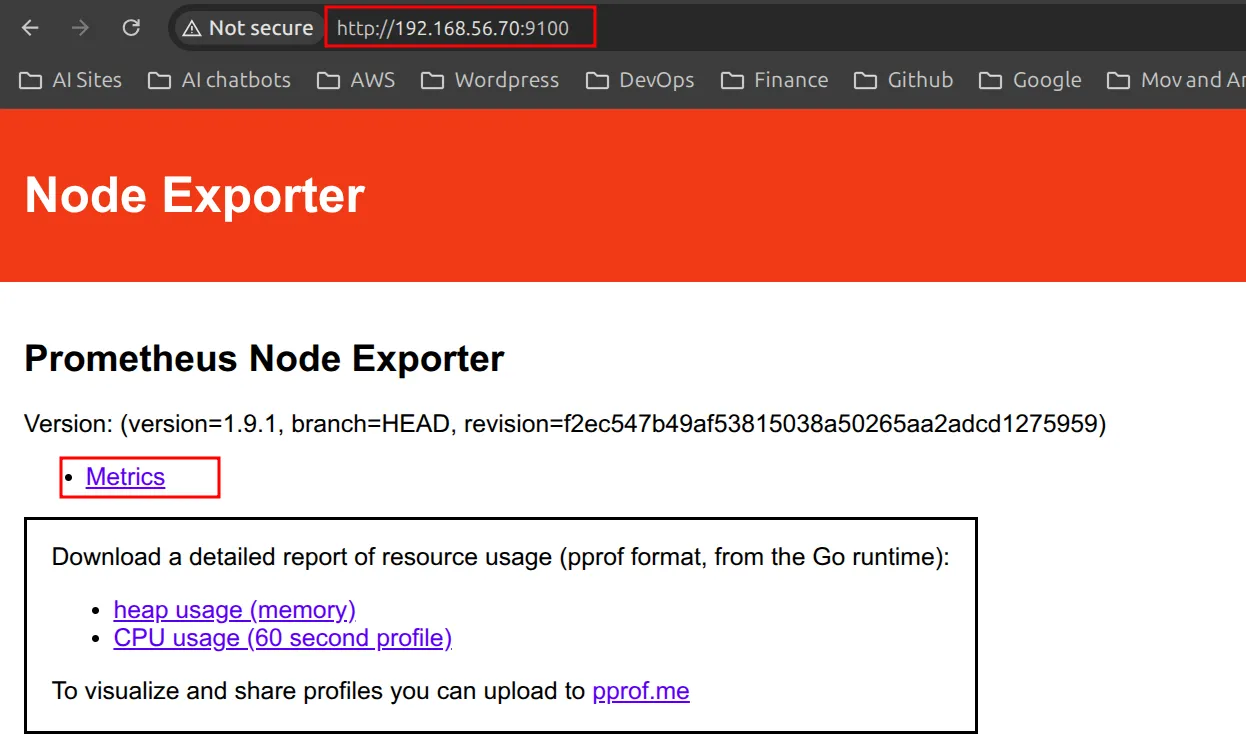
The last log line, TLS is disabled, means node_exporter serves plain HTTP on port 9100. Open http://192.168.56.70:9100 and click Metrics:
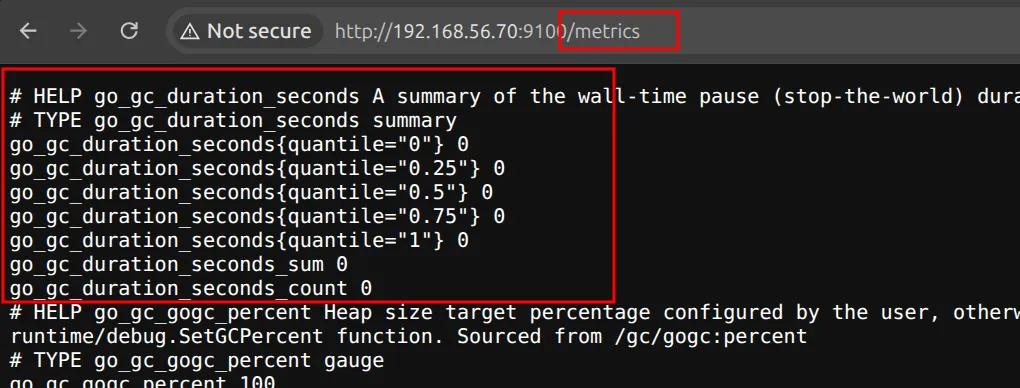
The same check from the terminal:
$ curl localhost:9100
$ curl localhost:9100/metrics | grep go_gc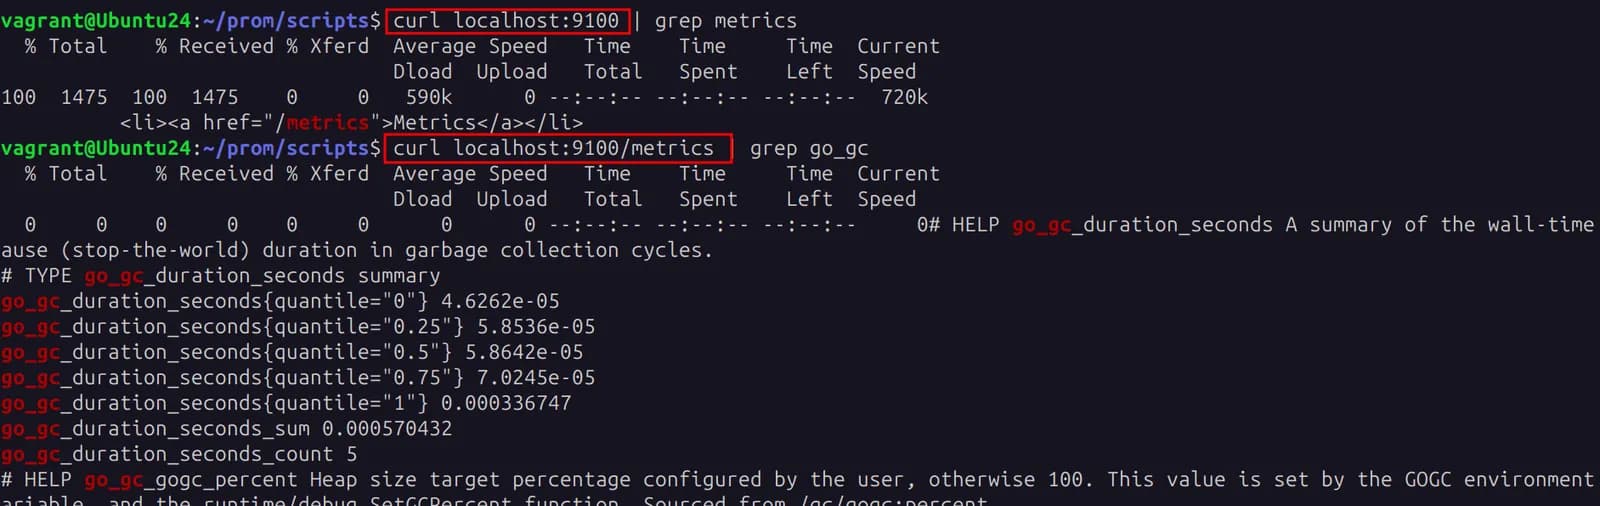
Add a job for it in /etc/prometheus/prometheus.yml and restart Prometheus (sudo systemctl restart prometheus):
scrape_configs:
  - job_name: "prometheus"
    static_configs:
      - targets: ["localhost:9090"]
        labels:
          app: "prometheus"

  # node_exporter on the Prometheus VM itself
  - job_name: "PrometheusVM"
    static_configs:
      - targets: ["192.168.56.70:9100"]
        labels:
          app: "Node_exporter_VM"
Monitor a second machine
- Create another VM. In a cloud environment, allow port 9100 from the Prometheus server in the security group.
- Install node_exporter on it with the same script.
- Confirm that
http://192.168.56.71:9100/metricsloads. - Add a job for it:
  - job_name: "Node_exporter_next_vm"
    static_configs:
      - targets: ["192.168.56.71:9100"]
        labels:
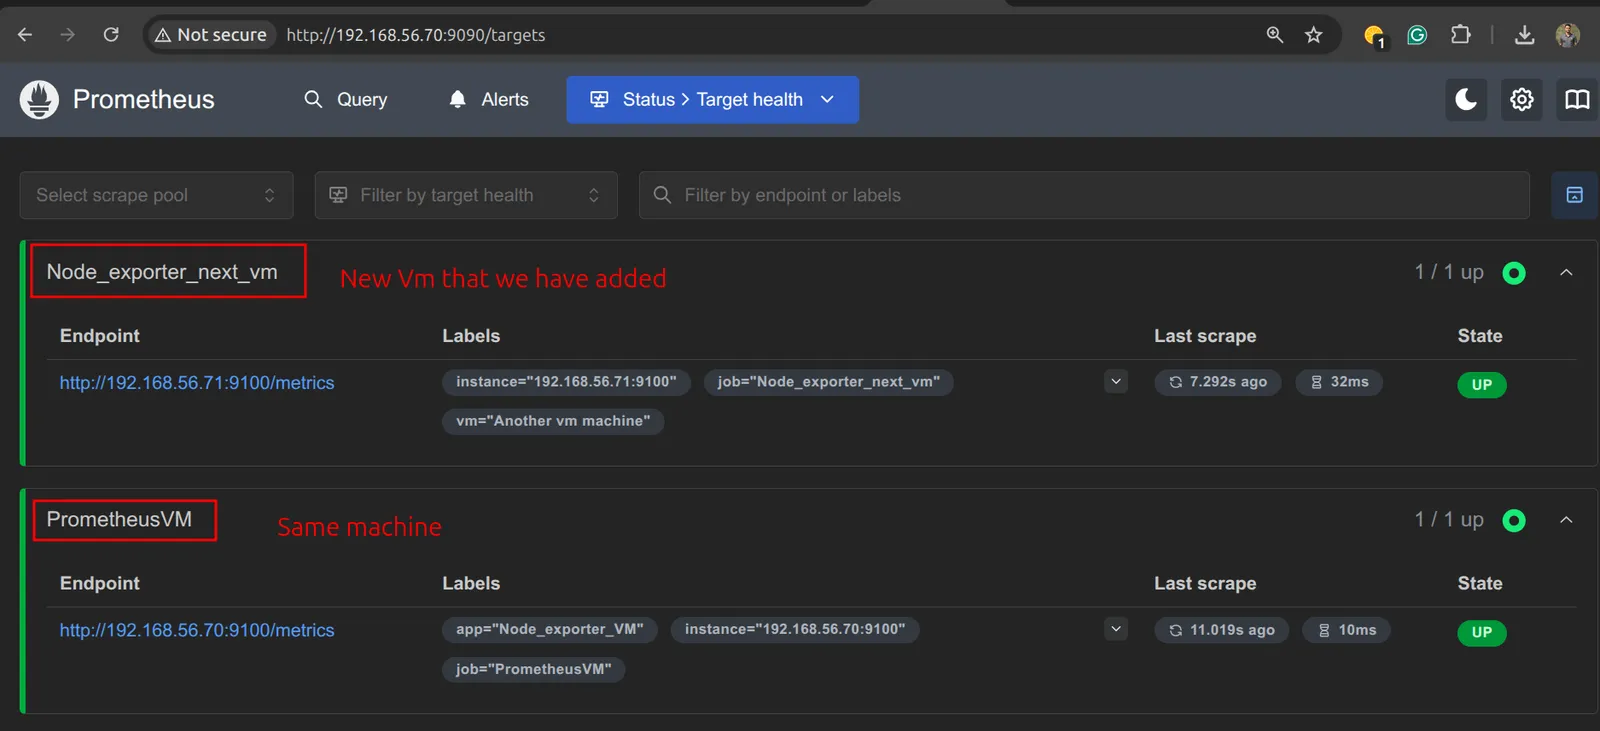
vm: "Another vm machine"After a restart, both node_exporter jobs are up:
Secure node_exporter with TLS and basic auth
At this point anyone on the network can read the metrics in plain text. node_exporter, like Prometheus itself, accepts a web config file that enables TLS and basic auth. The official guides on TLS encryption and basic auth apply it to the Prometheus UI; the same file format works for node_exporter on the monitored VM.
Step 1: Create a certificate
A self-signed certificate is sufficient for a lab; in production, use one signed by a CA. Generate it on the Prometheus server (confirm OpenSSL is installed with dpkg -l | grep openssl):
$ openssl req -new -newkey rsa:2048 -days 365 -nodes -x509 \
  -keyout node_exporter.key -out node_exporter.crt \
  -subj "/C=NP/ST=Kathmandu/L=Kirtipur/O=dipendra/CN=localhost" \
-addext "subjectAltName=DNS:localhost"| Flag | Meaning |
|---|---|
-new -newkey rsa:2048 | Create a new 2048-bit RSA key and certificate request |
-days 365 | Valid for one year |
-nodes | Do not protect the private key with a passphrase |
-x509 | Output a self-signed certificate instead of a request |
-subj | Subject fields (country, state, city, organisation, common name) |
-addext "subjectAltName=..." | Subject Alternative Name (SAN). Modern clients check the SAN, not the CN |
Keep a copy of node_exporter.crt in /etc/prometheus/ on the Prometheus server, where the scrape config references it later. Copy both files to the monitored VM:
$ scp node_exporter.crt node_exporter.key vagrant@192.168.56.71:Without a path after the :, the files land in the remote home directory (/home/vagrant). Copying directly into /etc/... fails with permission denied for a normal user, so copy to the home directory first and move the files with sudo.
Step 2: Enable TLS on node_exporter
On the monitored VM, create the web config file and move everything into /etc/node_exporter:
tls_server_config:
  cert_file: node_exporter.crt
key_file: node_exporter.key$ sudo mkdir /etc/node_exporter
$ sudo mv node_exporter.* config.yml /etc/node_exporter/
$ sudo chown -R node_exporter:node_exporter /etc/node_exporter

The relative paths in config.yml resolve because the certificate sits next to the config file. Point the service at the config with --web.config.file (for a manual run, ./node_exporter --web.config.file=config.yml):
[Unit]
Description=Node Exporter
Wants=network-online.target
After=network-online.target

[Service]
Type=simple
User=node_exporter
Group=node_exporter
ExecStart=/usr/local/bin/node_exporter \
  --web.config.file=/etc/node_exporter/config.yml

[Install]
WantedBy=multi-user.target$ sudo systemctl daemon-reload
$ sudo systemctl restart node_exporter
$ sudo systemctl status node_exporterThe log now reports TLS is enabled, followed immediately by errors:

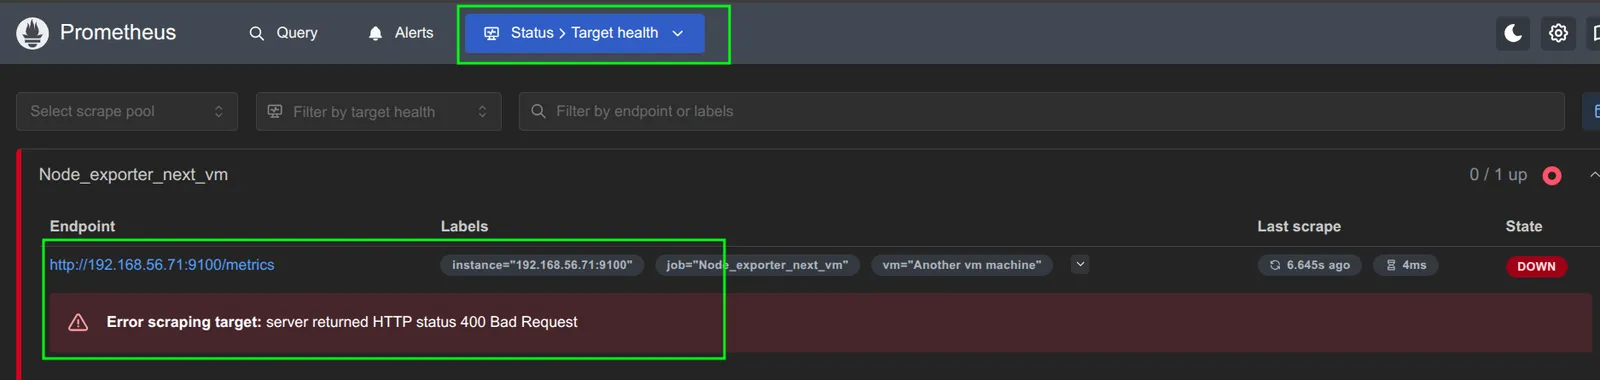
http: TLS handshake error from 192.168.56.70:46100: client sent an HTTP request to an HTTPS server means the server (node_exporter) now expects HTTPS, but the client (Prometheus at .70) still scrapes with plain HTTP. The same mismatch shows on the Prometheus side:
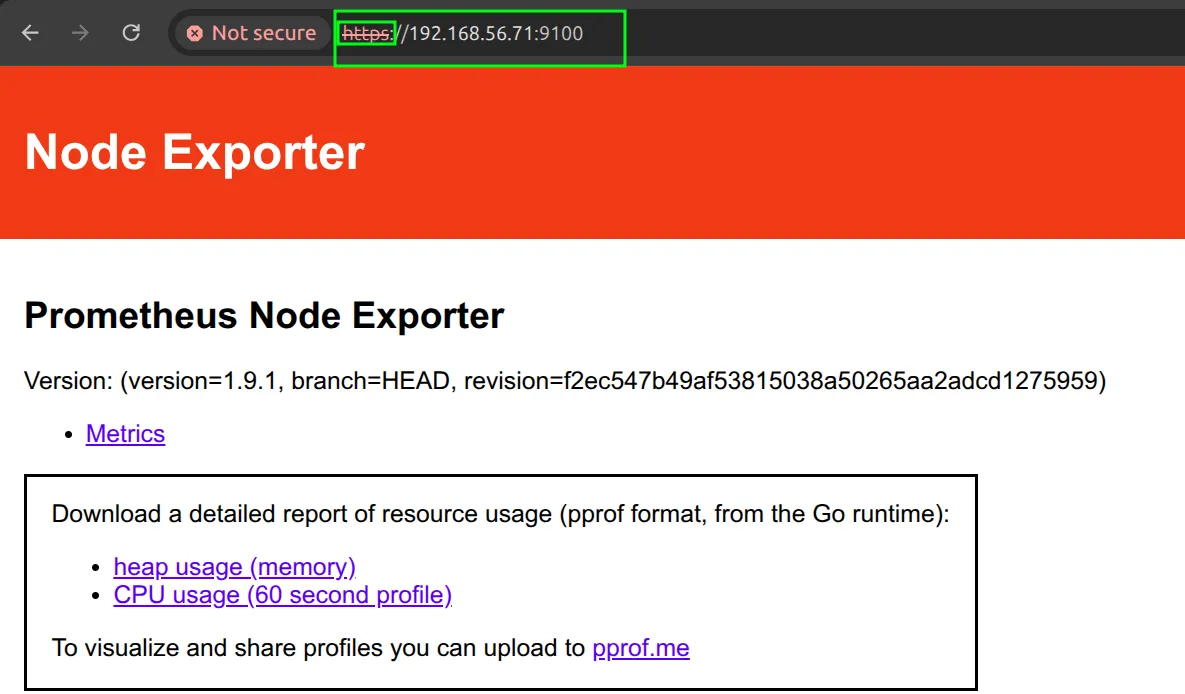
Locally, curl also rejects the self-signed certificate unless you add -k (skip certificate checks):
$ curl https://localhost:9100/metrics
curl: (60) SSL certificate problem: self-signed certificate
$ curl -k https://localhost:9100/metrics
Step 3: Scrape over HTTPS from Prometheus
On the Prometheus server, set scheme: https and a tls_config for that job, then restart Prometheus:
  - job_name: "Node_exporter_next_vm"
    scheme: https
    tls_config:
      ca_file: /etc/prometheus/node_exporter.crt
      insecure_skip_verify: true
    static_configs:
      - targets: ["192.168.56.71:9100"]
        labels:
vm: "Another vm machine"The target turns UP again, now with an https:// endpoint.
Step 4: Add basic auth
TLS encrypts the traffic, but anyone can still request the metrics. Basic auth adds a username and password. The web config accepts only a bcrypt hash, never the plain password. Generate the hash on any machine, for example with htpasswd from apache2-utils:
$ sudo apt install apache2-utils
$ htpasswd -nBC 12 "" | tr -d ':\n'
New password:
Re-type new password:
$2y$12$q9I0yLHWLBR81vPXysQ/vuq.tgTawF/GJZTGxOSRjN9Jb3AfJUIuS
Add the user and hash to /etc/node_exporter/config.yml on the monitored VM, then sudo systemctl restart node_exporter:
tls_server_config:
  cert_file: node_exporter.crt
  key_file: node_exporter.key
basic_auth_users:
dipen: $2y$12$q9I0yLHWLBR81vPXysQ/vuq.tgTawF/GJZTGxOSRjN9Jb3AfJUIuSPrometheus has no credentials yet, so the target fails with 401:

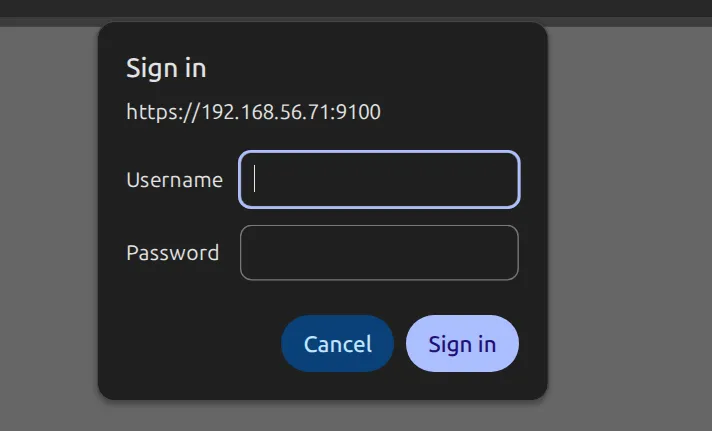
Opening the endpoint in a browser now prompts for a login. Enter the plain password (test123 in this lab), not the hash:
Add the same credentials to the Prometheus job and restart Prometheus:
  - job_name: "Node_exporter_next_vm"
    scheme: https
    basic_auth:
      username: dipen
      password: test123
    tls_config:
      ca_file: /etc/prometheus/node_exporter.crt
      insecure_skip_verify: true
    static_configs:
      - targets: ["192.168.56.71:9100"]
        labels:
          vm: "Another vm machine"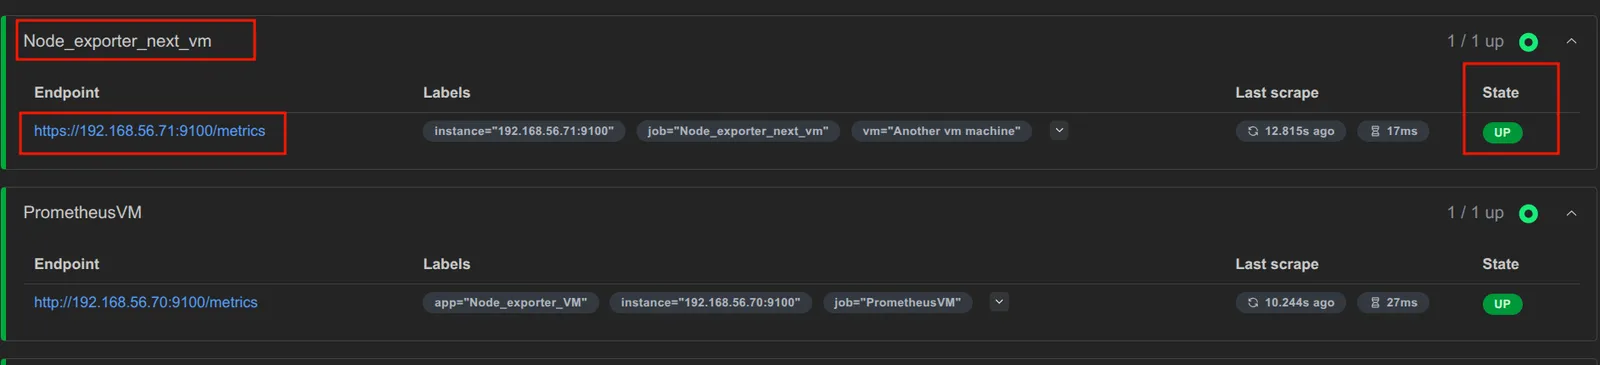
Monitor Docker: engine metrics and cAdvisor
node_exporter sees the host, not the containers on it. Docker has two separate metric sources, both running on the monitored VM (192.168.56.71).
| Docker engine metrics | cAdvisor metrics |
|---|---|
| How much CPU the Docker daemon uses | CPU and memory used by each container |
| Number of failed image builds | Number of processes inside a container |
| Time taken by container actions | Container uptime |
| Nothing per container | Everything per container |
Docker engine metrics
The Docker daemon has a built-in Prometheus endpoint (Docker docs). Turn it on in /etc/docker/daemon.json and restart Docker:
{
  "metrics-addr": "0.0.0.0:9323"
}$ sudo systemctl restart docker
$ curl localhost:9323/metrics | tail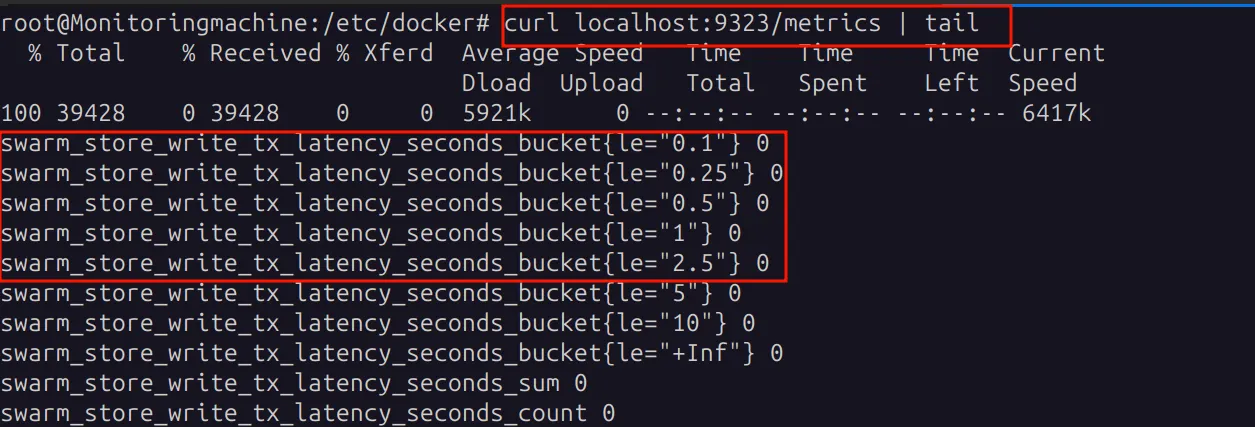
Add the job on the Prometheus server:
  - job_name: "Docker_engine"
    static_configs:
- targets: ["192.168.56.71:9323"]cAdvisor
cAdvisor (container advisor) runs as a container, reads resource usage for every running container and exposes it in Prometheus format. The Prometheus cAdvisor guide covers it in more depth. Run it with Docker Compose (see Docker Compose for the basics):
services:
  cadvisor:
    image: gcr.io/cadvisor/cadvisor
    container_name: cadvisor
    privileged: true
    devices:
      - "/dev/kmsg:/dev/kmsg"
    volumes:
      - /:/rootfs:ro
      - /var/run:/var/run:ro
      - /var/lib/docker/:/var/lib/docker:ro
      - /dev/disk/:/dev/disk:ro
    ports:
- 8080:8080$ sudo docker compose up -d
$ sudo docker ps
$ curl localhost:8080/metrics
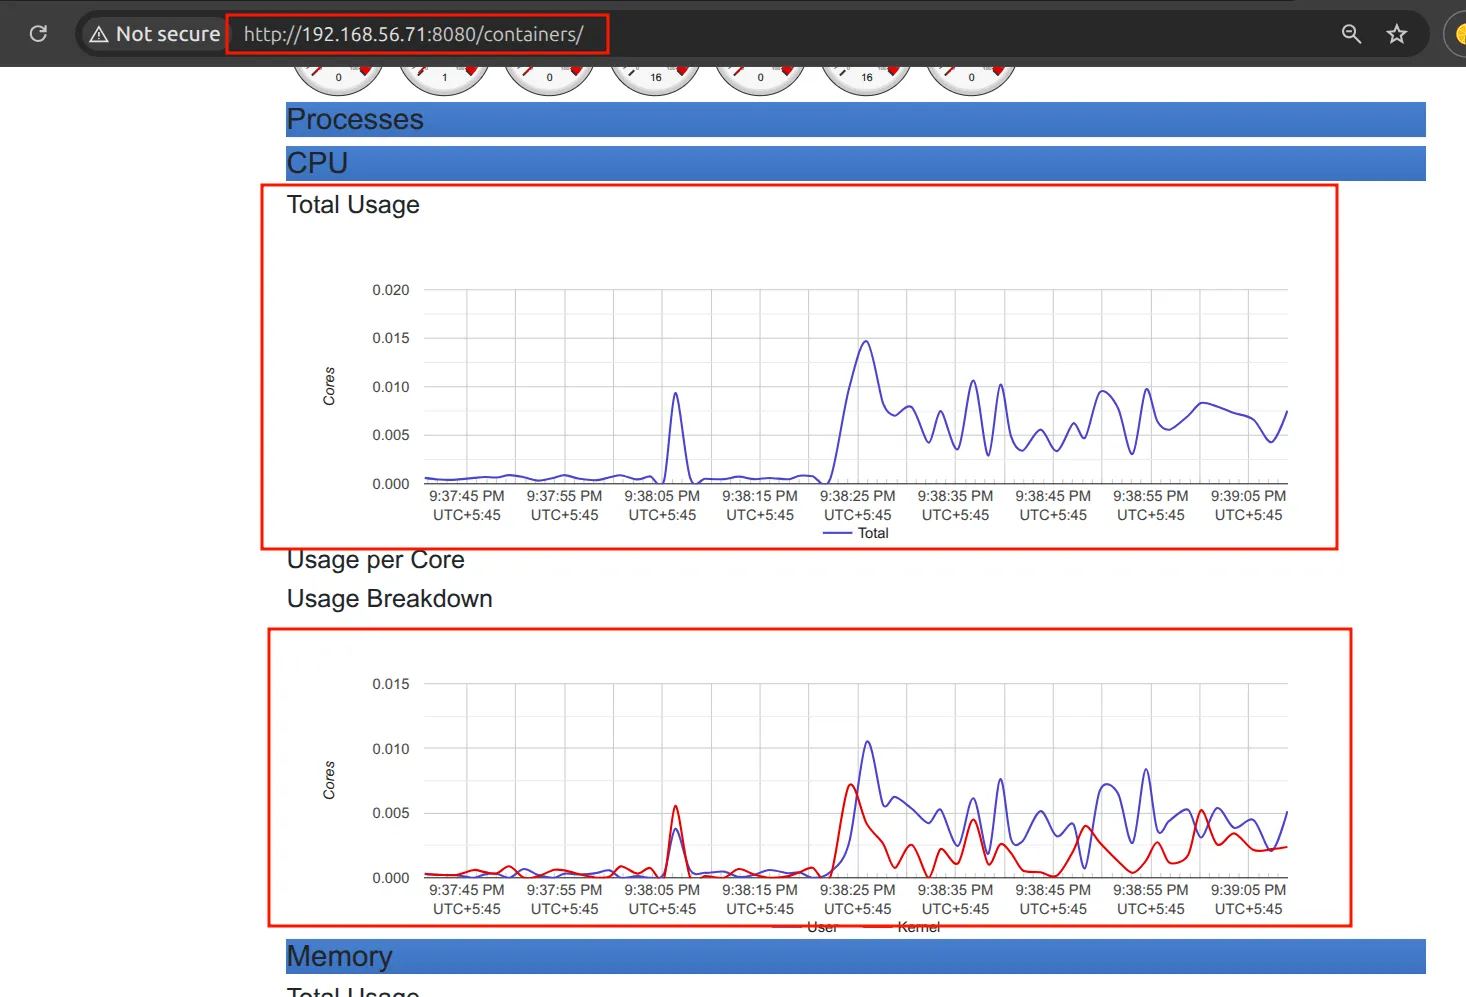
cAdvisor also serves a small web UI at http://<vm_ip>:8080:
Add the job and restart Prometheus:
  - job_name: "cAdvisor"
    static_configs:
      - targets: ["192.168.56.71:8080"]
At this point the full scrape config looks like this:
global:
  scrape_interval: 15s
  evaluation_interval: 15s

scrape_configs:
  - job_name: "prometheus"
    static_configs:
      - targets: ["localhost:9090"]
        labels:
          app: "prometheus"

  - job_name: "PrometheusVM"
    static_configs:
      - targets: ["192.168.56.70:9100"]
        labels:
          app: "Node_exporter_VM"

  - job_name: "Node_exporter_next_vm"
    scheme: https
    basic_auth:
      username: dipen
      password: test123
    tls_config:
      ca_file: /etc/prometheus/node_exporter.crt
      insecure_skip_verify: true
    static_configs:
      - targets: ["192.168.56.71:9100"]
        labels:
          vm: "Another vm machine"

  - job_name: "Docker_engine"
    static_configs:
      - targets: ["192.168.56.71:9323"]

  - job_name: "cAdvisor"
    static_configs:
- targets: ["192.168.56.71:8080"]The metrics are now collected, but only as raw numbers and simple graphs. The next part adds Grafana dashboards.
Relabeling
Relabeling rewrites labels to control which targets are scraped and how their series are labeled. Rules use regular expressions (regex) to match label values:
| Pattern | Meaning | Matches |
|---|---|---|
prod | Exact text (Prometheus anchors the whole value) | only prod |
prod|dev | Either option | prod or dev |
web.* | web followed by anything | web, web01, webserver |
(.*):.* | Capture everything before the colon as $1 | 192.168.1.1 from 192.168.1.1:80 |
There are two stages:
| Stage | Runs | Sees | Typical use |
|---|---|---|---|
relabel_configs | Before the scrape | Target labels from service discovery (__address__, __meta_ec2_tag_env...) | Keep or drop targets, change the scrape address, add labels to every series of a target |
metric_relabel_configs | After the scrape, before storage | Labels of each scraped series | Drop noisy or high-cardinality metrics, remove sensitive labels |
In short, relabel_configs decides whether and how to scrape a target, and metric_relabel_configs decides which scraped series to keep.
Keep, drop and replace
scrape_configs:
  - job_name: example
    relabel_configs:
      # keep: scrape only EC2 instances tagged env=prod
      - source_labels: [__meta_ec2_tag_env]
        regex: prod
        action: keep
      # drop: skip instances tagged env=dev
      - source_labels: [__meta_ec2_tag_env]
        regex: dev
        action: drop
      # replace: __address__=192.168.1.1:80 becomes ip=192.168.1.1
      - source_labels: [__address__]
        regex: (.*):.*
        target_label: ip
        action: replace
replacement: $1Several source labels
With more than one source label, the values are joined with ; before the regex is applied. Change the joiner with separator:
    relabel_configs:
      # keeps targets where env=dev AND team=marketing
      - source_labels: [env, team]
        regex: dev;marketing
        action: keep
      # same rule with a custom separator
      - source_labels: [env, team]
        separator: "-"
        regex: dev-marketing
action: keeplabeldrop, labelkeep and labelmap
These match against label names, not values:
    relabel_configs:
      # remove one label
      - regex: __meta_ec2_owner_id
        action: labeldrop
      # keep only instance and job, drop all others
      - regex: instance|job
        action: labelkeep
      # copy every __meta_ec2_tag_<name> to ec2_<name>
      - regex: __meta_ec2_tag_(.+)
        action: labelmap
replacement: ec2_${1}| Property | Meaning | Example |
|---|---|---|
source_labels | Labels whose values are matched | [__meta_ec2_tag_env] |
regex | Pattern to match | prod, (.*):.* |
action | What to do | keep, drop, replace, labeldrop, labelkeep, labelmap |
target_label | Label to write (for replace) | ip |
replacement | Value to write, can use capture groups | $1 |
separator | Joiner for several source labels | ; (default) |
Restart or reload Prometheus after every change.
Pushgateway for short-lived jobs
A batch job may run for a few seconds and exit before Prometheus scrapes it. The Pushgateway sits in between: the job pushes its metrics before it exits, the Pushgateway holds them, and Prometheus scrapes the Pushgateway on its normal interval.
#!/bin/bash
GATEWAY_VERSION="v1.11.1"
GATEWAY_FILE="pushgateway-1.11.1.linux-amd64"

wget https://github.com/prometheus/pushgateway/releases/download/"${GATEWAY_VERSION}"/"${GATEWAY_FILE}".tar.gz
tar xvf "${GATEWAY_FILE}".tar.gz
cd "${GATEWAY_FILE}"
sudo useradd --no-create-home --shell /bin/false pushgateway
sudo cp pushgateway /usr/local/bin
sudo chown pushgateway:pushgateway /usr/local/bin/pushgateway
cd -
sudo cp pushgateway.service /etc/systemd/system/pushgateway.service
sudo systemctl daemon-reload
sudo systemctl start pushgateway
sudo systemctl enable pushgateway
sudo systemctl status pushgateway[Unit]
Description=Prometheus Pushgateway
Wants=network-online.target
After=network-online.target
[Service]
User=pushgateway
Group=pushgateway
Type=simple
ExecStart=/usr/local/bin/pushgateway
[Install]
WantedBy=multi-user.targetThe Pushgateway listens on port 9091 (curl localhost:9091/metrics). Scrape it with honor_labels: true, so the job and instance labels pushed by the batch job are kept instead of being replaced by the Pushgateway's own:
scrape_configs:
  - job_name: pushgateway
    honor_labels: true
    static_configs:
- targets: ["192.168.1.151:9091"] # the host running PushgatewayJobs can push in two ways. With plain HTTP:
$ echo "my_batch_job_duration_seconds 45.2" | curl --data-binary @- \
http://localhost:9091/metrics/job/my_batch_job/instance/server1Or with a client library, which handles the exposition format:
from prometheus_client import CollectorRegistry, Gauge, push_to_gateway

registry = CollectorRegistry()
job_duration = Gauge('batch_job_duration_seconds', 'Job duration', registry=registry)
job_duration.set(45.2)
push_to_gateway('localhost:9091', job='my_batch_job', registry=registry)Troubleshooting
| Symptom | Cause | Fix |
|---|---|---|
Hard to stop a manually started ./prometheus & | No service manager | Find the PID with ps aux | grep prometheus and kill it, then run it under systemd |
| A config change has no effect | Prometheus reads the file only at start | promtool check config /etc/prometheus/prometheus.yml, then sudo systemctl restart prometheus. Check Status → Configuration |
node_exporter log: TLS handshake error ... client sent an HTTP request to an HTTPS server | node_exporter has TLS on, Prometheus still uses HTTP | Add scheme: https and tls_config to the job |
Target error: server returned HTTP status 400 Bad Request | Same HTTP vs HTTPS mismatch, seen from Prometheus | Same fix |
curl: (60) SSL certificate problem: self-signed certificate | curl does not trust the self-signed certificate | curl -k, or curl --cacert node_exporter.crt |
| Target error with a certificate name mismatch | Certificate issued for localhost, scraped by IP | Add the IP to the SAN, or use insecure_skip_verify: true in a lab |
Target error: server returned HTTP status 401 Unauthorized | basic_auth_users set on the exporter, no credentials in Prometheus | Add basic_auth with the plain password to the job |
scp to /etc/... fails with permission denied | Normal user cannot write there | Copy to the home directory, then sudo mv |
| Docker engine target down from another host | metrics-addr bound to 127.0.0.1 | Bind to 0.0.0.0:9323 or the VM IP and restart Docker |
Key takeaways
- Run Prometheus and every exporter as a systemd service under its own user; manual runs are only for a first look.
- Each target is a job in
scrape_configs, and Status → Target health shows immediately whether a scrape works and why it fails. - Enabling TLS on an exporter breaks scraping until the job uses
scheme: https. A 400 error indicates a protocol mismatch; a 401 indicates missing credentials. - node_exporter covers the host, Docker's
metrics-addrcovers the daemon, and cAdvisor covers each container. relabel_configsdecides what to scrape;metric_relabel_configsdecides what to keep.- Use the Pushgateway only for short-lived batch jobs, and scrape it with
honor_labels: true.
Next in this series: Prometheus Alerting With Alertmanager, Slack and Grafana
Keep reading
- Prometheus Alerting With Alertmanager, Slack and Grafana
Write Prometheus alert rules, route them through Alertmanager to a Slack channel, add recovery alerts, and build a node_exporter dashboard in Grafana.
- Dockerfile Instructions, Best Practices and Harbor Registry
Every Dockerfile instruction in one table, an annotated multi-stage build, image best practices, and pushing images to a private Harbor registry and Docker Hub.
- Install Docker on Ubuntu and Essential Docker Commands
Install Docker Engine on Ubuntu from Docker's official apt repository, then manage containers, images, networks and volumes with the essential CLI commands.