Prometheus Alerting With Alertmanager, Slack and Grafana
Write Prometheus alert rules, route them through Alertmanager to a Slack channel, add recovery alerts, and build a node_exporter dashboard in Grafana.


ON THIS PAGE
Metrics only help during an incident if someone is told about the problem and can see it on a dashboard. This guide turns the part 1 lab, where Prometheus on 192.168.56.70 scrapes node_exporter, Docker engine metrics and cAdvisor on 192.168.56.71, into a working alerting pipeline: alert rules, Alertmanager routing to Slack, recovery alerts and Grafana dashboards. It also covers two problems from the lab, a config file in the wrong location and an empty Slack title.
Prerequisites
- The Prometheus lab from part 1, with all targets UP.
- A Slack workspace where you can create apps and incoming webhooks.
sudoaccess on the Prometheus VM.
How alerting works in Prometheus
Prometheus only evaluates alert conditions; it cannot send emails or chat messages. Delivery belongs to a separate service, Alertmanager:
- Alerting rules in Prometheus define the conditions. Each rule is a PromQL expression; when it returns results, the alert is active.
- Prometheus sends active alerts to Alertmanager.
- Alertmanager groups them, silences or inhibits some, and turns the rest into notifications for receivers such as email, Slack, webhooks or PagerDuty.
Alerting rules
A rule lives in a rule group inside a rules file:
groups:
  - name: node
    rules:
      - alert: NodeDown
        expr: up{job="node"} == 0
for: 5mfor requires the expression to stay true for that duration before the alert fires. A single failed scrape (a network blip, a scrape timeout) should not page anyone, so most rules wait a few minutes. During that time the alert moves through three states, visible on the Alerts page of the Prometheus UI:
| State | Meaning |
|---|---|
| Inactive | The expression returns nothing. No problem |
| Pending | The expression returns results, but not yet for the full for duration. A problem is suspected but not yet confirmed |
| Firing | True for longer than for. The alert is sent to Alertmanager |
Labels classify an alert, and Alertmanager uses them to route and group:
groups:
  - name: node
    rules:
      - alert: NodeDown
        expr: up{job="node"} == 0
        labels:
          severity: warning

      - alert: MultipleNodesDown
        expr: avg without(instance) (up{job="node"}) <= 0.5
        labels:
severity: criticalAnnotations carry extra text such as a description. They are not part of the alert's identity, so they cannot be used for routing. They are Go templates: {{ .Labels }} (or $labels) gives the alert labels, {{ .Labels.instance }} one label, and {{ .Value }} the value that triggered it:
groups:
  - name: node
    rules:
      - alert: NodeFilesystemLowSpace
        expr: |
          100 * node_filesystem_free_bytes{job="node"} /
          node_filesystem_size_bytes{job="node"} < 70
        annotations:
description: "Filesystem {{ .Labels.device }} on {{ .Labels.instance }} is low on space. Current available space is {{ .Value }}"Install Alertmanager
Install Alertmanager 0.28.1 on the Prometheus VM with a script and a systemd unit, following the same pattern as Prometheus in part 1:
#!/bin/bash
sudo useradd --no-create-home --shell /bin/false alertmanager
sudo mkdir /etc/alertmanager

wget https://github.com/prometheus/alertmanager/releases/download/v0.28.1/alertmanager-0.28.1.linux-amd64.tar.gz
tar xzf alertmanager-0.28.1.linux-amd64.tar.gz
cd alertmanager-0.28.1.linux-amd64

# Config goes to /etc/alertmanager, data to /var/lib/alertmanager
sudo mv alertmanager.yml /etc/alertmanager
sudo chown -R alertmanager:alertmanager /etc/alertmanager
sudo mkdir /var/lib/alertmanager
sudo chown -R alertmanager:alertmanager /var/lib/alertmanager

# Binaries: the server and amtool (the command-line client)
sudo cp alertmanager /usr/local/bin
sudo cp amtool /usr/local/bin
sudo chown alertmanager:alertmanager /usr/local/bin/alertmanager
sudo chown alertmanager:alertmanager /usr/local/bin/amtool
cd -

sudo cp alertmanager.service /etc/systemd/system/
sudo systemctl daemon-reload
sudo systemctl start alertmanager
sudo systemctl enable alertmanager
sudo systemctl status alertmanager[Unit]
Description=Alert Manager
Wants=network-online.target
After=network-online.target
[Service]
Type=simple
User=alertmanager
Group=alertmanager
ExecStart=/usr/local/bin/alertmanager \
--config.file=/etc/alertmanager/alertmanager.yml \
--storage.path=/var/lib/alertmanager
Restart=always
[Install]
WantedBy=multi-user.target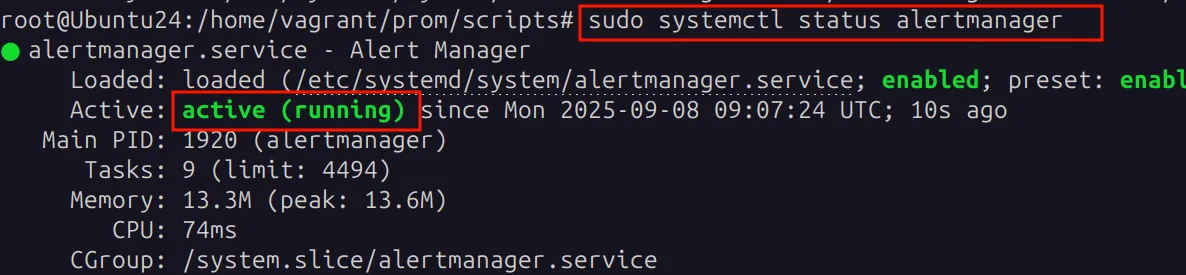
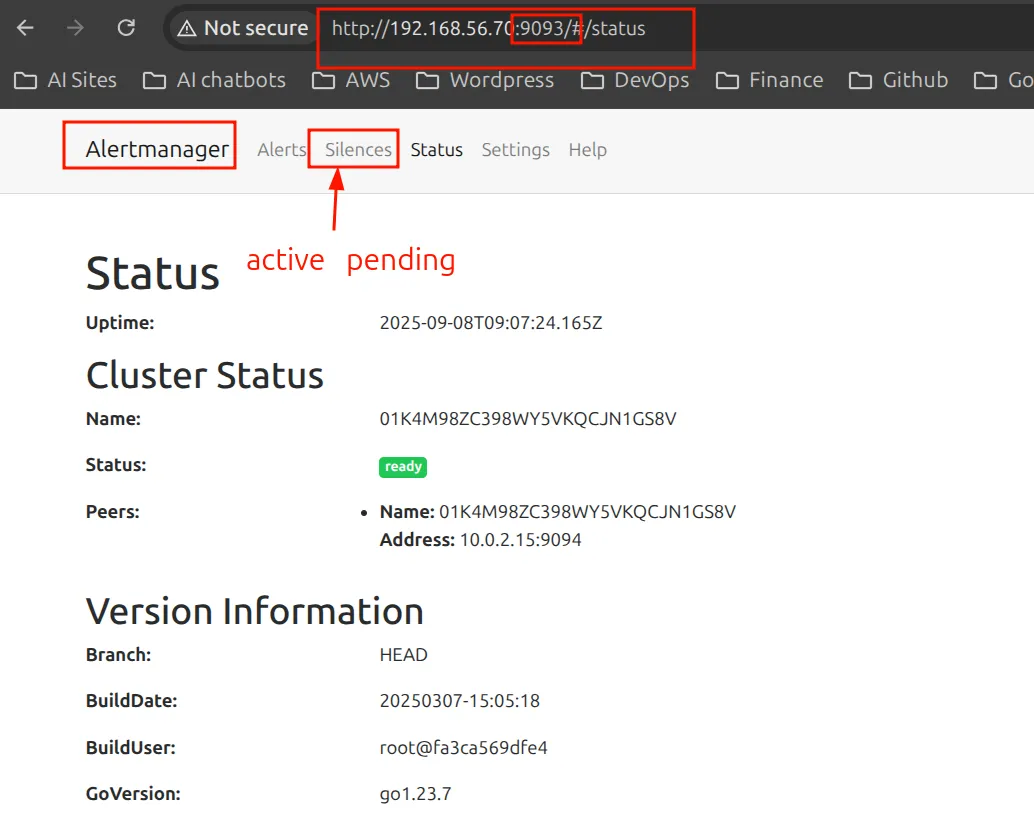
The UI runs on port 9093. The Silences tab mutes alerts, as described below:
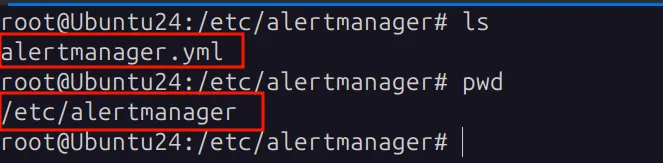
Edit the config file the unit file points to, /etc/alertmanager/alertmanager.yml. In my lab, a copy created in /etc/prometheus by mistake caused a long debugging session later (see Troubleshooting).
Write the alert rules
The rules watch the three jobs on the monitored VM from part 1. The job values must match the job_name entries in prometheus.yml exactly:
groups:
  - name: my-alerts
    interval: 15s # how often this group is evaluated
    rules:
      - alert: NodeDown
        expr: up{job="Node_exporter_next_vm"} == 0
        for: 2m # wait 2 minutes before firing
        labels:
          team: infra
          env: dev
        annotations:
          message: "instance {{ .Labels.instance }} is currently down"

      - alert: Docker-engine
        expr: up{job="Docker_engine"} == 0
        for: 0m # fire immediately
        labels:
          team: microservices
          env: prod
        annotations:
          message: "{{ .Labels.instance }} is currently down"

      - alert: Frontend_App_Down
        expr: up{job="cAdvisor"} == 0
        for: 0m
        labels:
          team: Frontend
          env: dev
        annotations:
message: "instance {{ .Labels.instance }} is currently down"Next, load the rules and point Prometheus at Alertmanager. A relative path in rule_files resolves from the directory of prometheus.yml, so rules.yaml must sit in /etc/prometheus:
global:
  scrape_interval: 15s
  evaluation_interval: 15s

alerting:
  alertmanagers:
    - static_configs:
        - targets:
            - 192.168.56.70:9093 # Alertmanager host and port

rule_files:
  - rules.yaml

scrape_configs:
  # same jobs as in part 1: prometheus, PrometheusVM,
# Node_exporter_next_vm, Docker_engine, cAdvisorValidate both files and restart Prometheus:
$ promtool check rules /etc/prometheus/rules.yaml
$ promtool check config /etc/prometheus/prometheus.yml
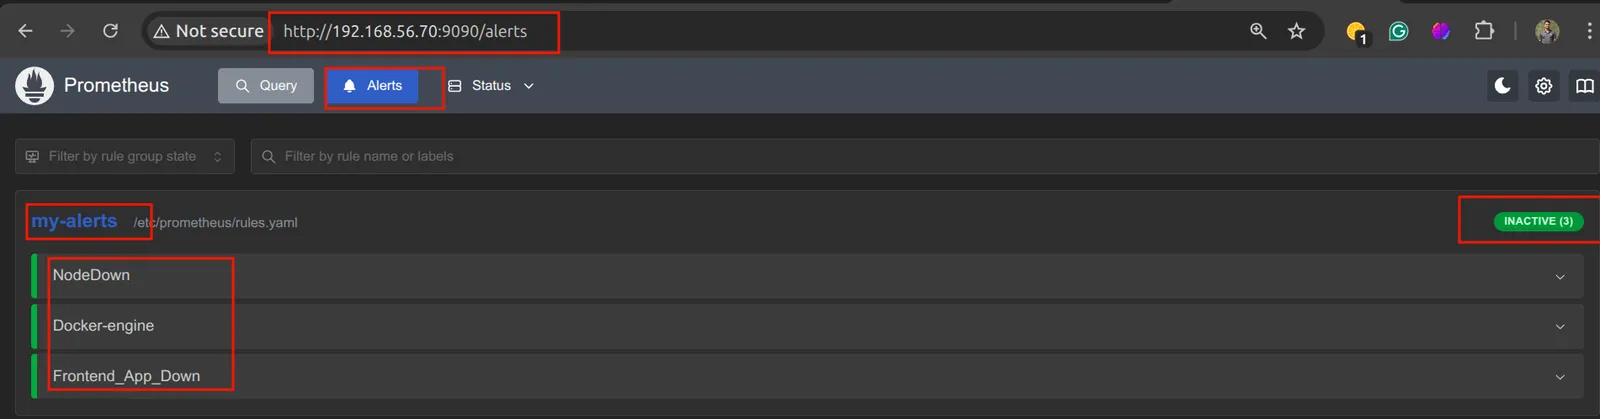
$ sudo systemctl restart prometheusAll three rules show up as inactive:
To test the rules, stop Docker on the monitored VM. This also stops the cAdvisor container, so two targets go down:
$ sudo systemctl stop docker
Stopping 'docker.service', but its triggering units are still active:
docker.socket
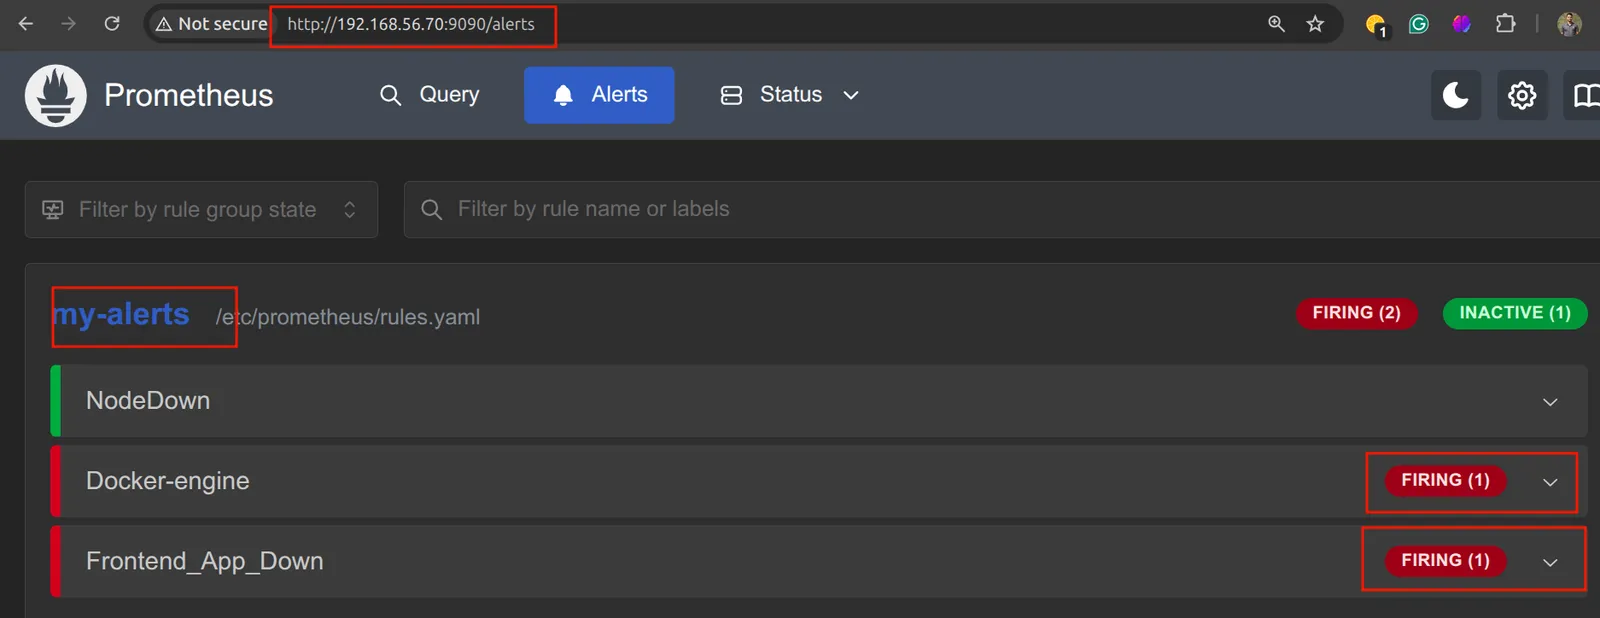
The warning means docker.socket can start Docker again on the next API call; stop docker.socket as well to keep Docker down. Both alerts fire immediately because their for is 0m:
Configure Alertmanager
alertmanager.yml has three main sections:
| Section | Purpose |
|---|---|
global | Defaults shared by all receivers (SMTP server, Slack API URL...). Can be overridden per receiver |
route | A tree of rules that decides which receiver gets which alert |
receivers | Named destinations, each with one or more notifiers (email, Slack, webhook...) |
The first version sends everything to the default web.hook receiver:
route:
  group_by: ['alertname']
  group_wait: 30s      # wait before the first notification for a new group
  group_interval: 5m   # wait before notifying about new alerts in the same group
  repeat_interval: 1h  # resend if the alert is still firing
  receiver: 'web.hook' # default receiver

receivers:
  - name: 'web.hook'
    webhook_configs:
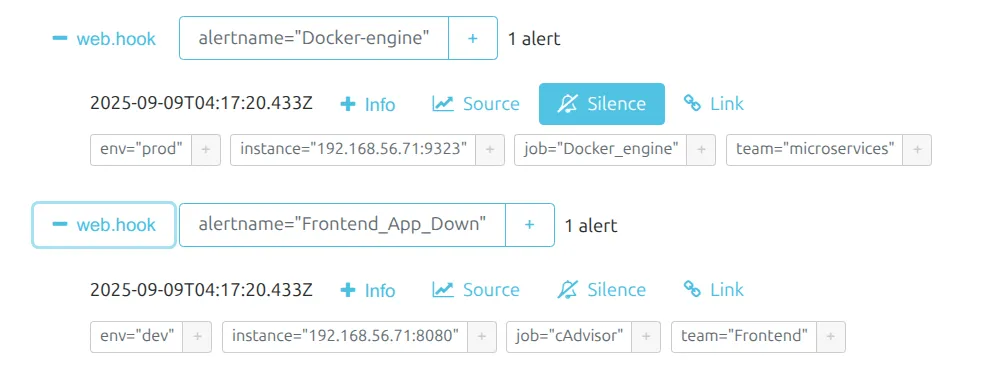
- url: 'http://127.0.0.1:5001/'With Docker still stopped, both alerts arrive in the Alertmanager UI, grouped by alertname and carrying the labels from the rules:
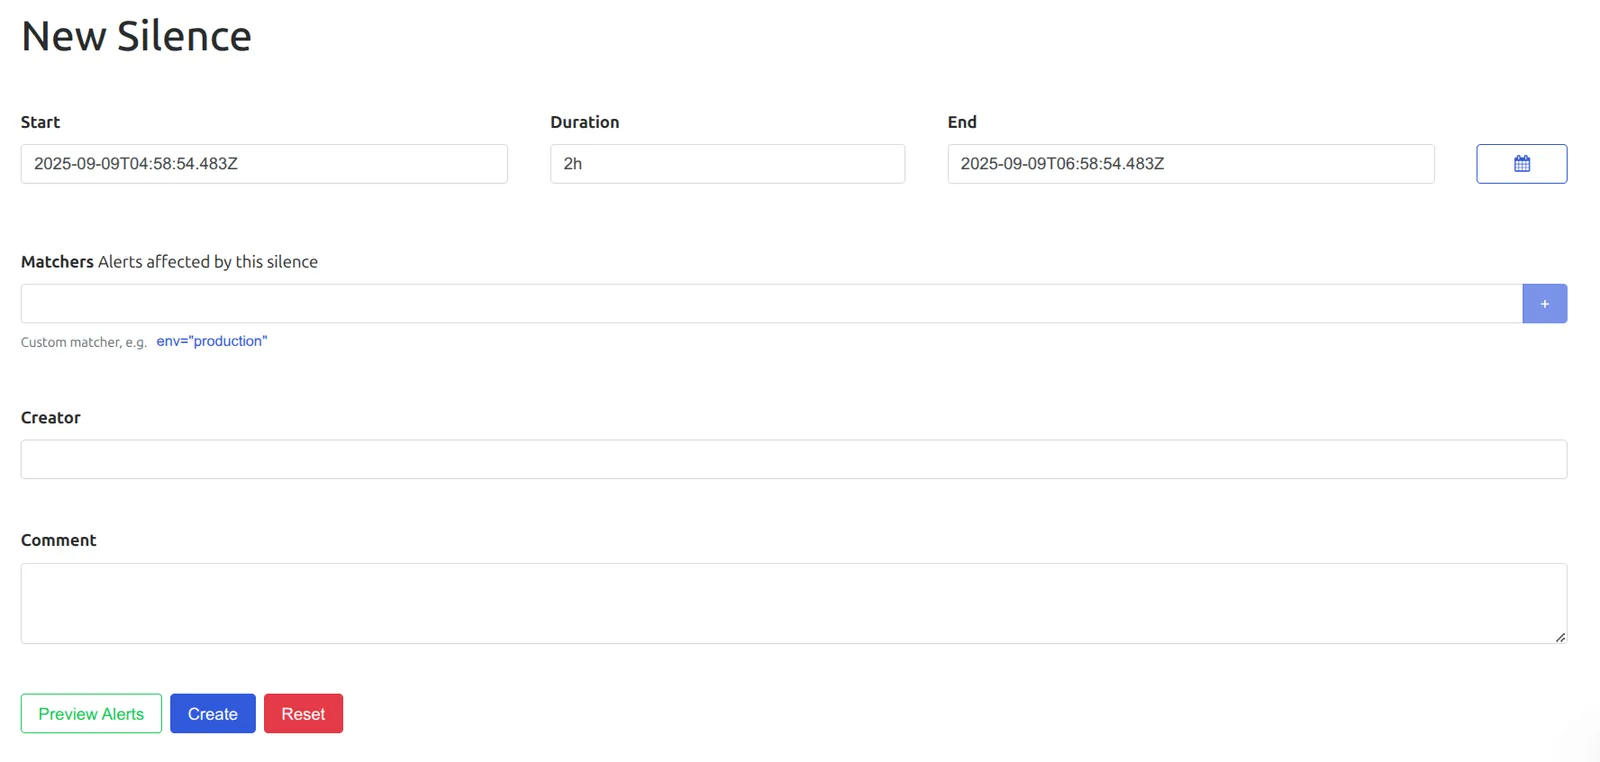
Silences mute notifications for a time window, for example during a planned one-hour upgrade. Click Silence on an alert, or create one with matchers such as env="production":
Routing rules
- Every config has one root route. Alerts that match no sub-route go to its receiver.
- Sub-routes under
routes:filter on labels. Alerts are checked against them in order. - Matching stops at the first sub-route that matches, unless that route has
continue: true. group_bytakes label names. Alerts with the same values for those labels are sent as one notification. Without it, all alerts of a route are combined into a single notification.
There are two ways to match labels. match_re (and match) is the old form and is deprecated. matchers is the current form and supports =, !=, =~ (regex) and !~:
route:
  receiver: staff
  group_by: ['alertname', 'job']
  routes:
    - matchers:
        - job =~ "node|windows"
      receiver: infra-email
    - matchers:
        - job = "kubernetes"
receiver: k8s-slackTo deliver one alert to several receivers, use continue: true:
route:
  receiver: default-receiver
  group_by: ['alertname', 'job']
  routes:
    - matchers:
        - job = "kubernetes"
      receiver: k8s-email
      continue: true # keep checking the next routes after this match
    - matchers:
        - severity = "critical"
receiver: critical-slackHere an alert with job="kubernetes" and severity="critical" goes to both k8s-email and critical-slack. Alerts that match neither go to default-receiver.
Like Prometheus, Alertmanager reads its config only at start. After an edit, validate the file, then restart or reload with any one of the last three commands:
$ amtool check-config /etc/alertmanager/alertmanager.yml
$ sudo systemctl restart alertmanager
$ sudo killall -HUP alertmanager
$ curl -X POST http://localhost:9093/-/reloadThe Alertmanager configuration reference lists every receiver and option.
Send alerts to Slack
Slack accepts messages through an incoming webhook, a secret URL that posts to one channel (Slack docs).
-
Create a workspace and a channel. This lab uses
#alert-manager-practicein thedevops practiceworkspace.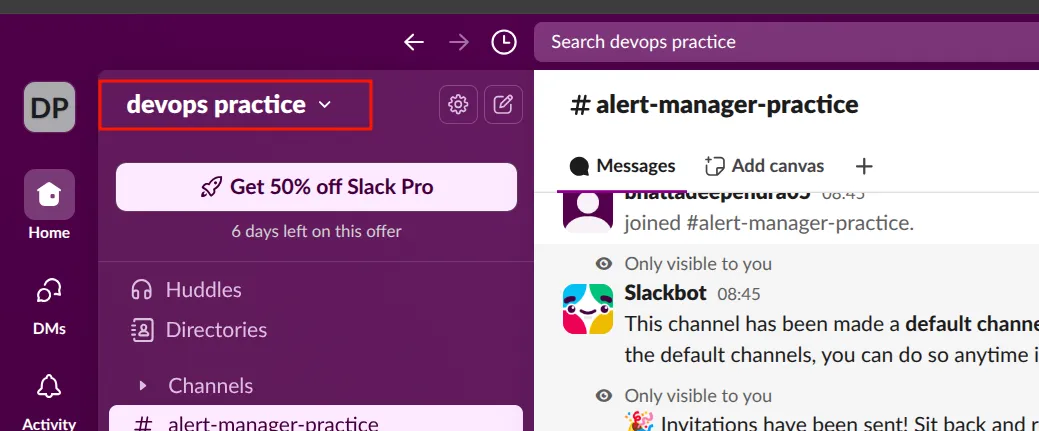
-
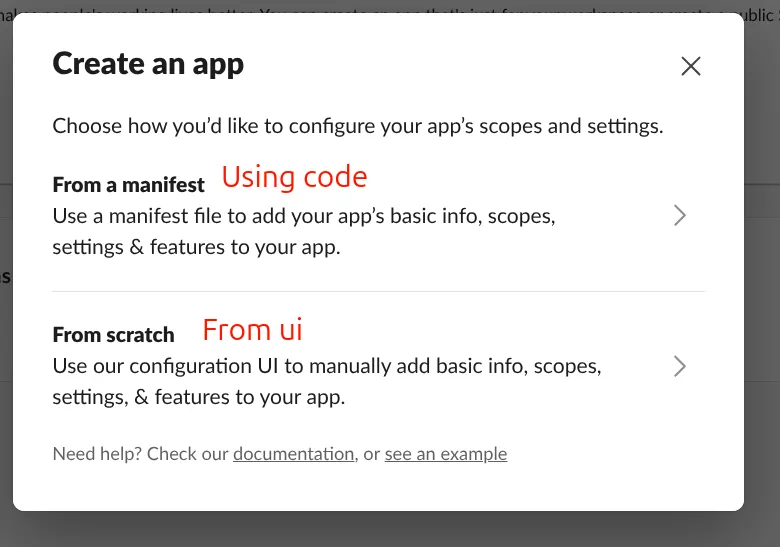
On the Slack webhooks page, click Create an app and choose From scratch.
-
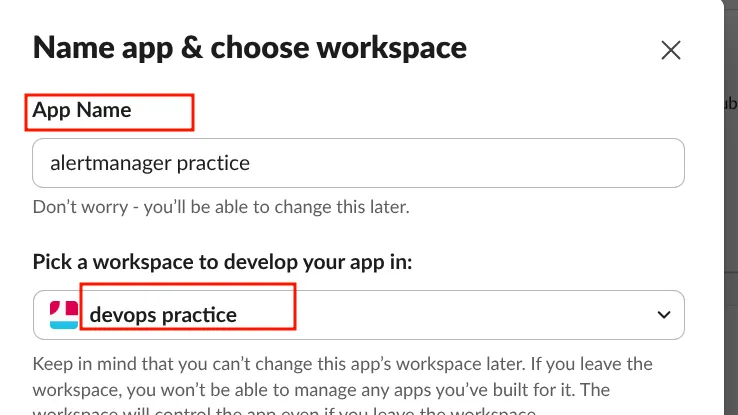
Name the app and pick the workspace.
-
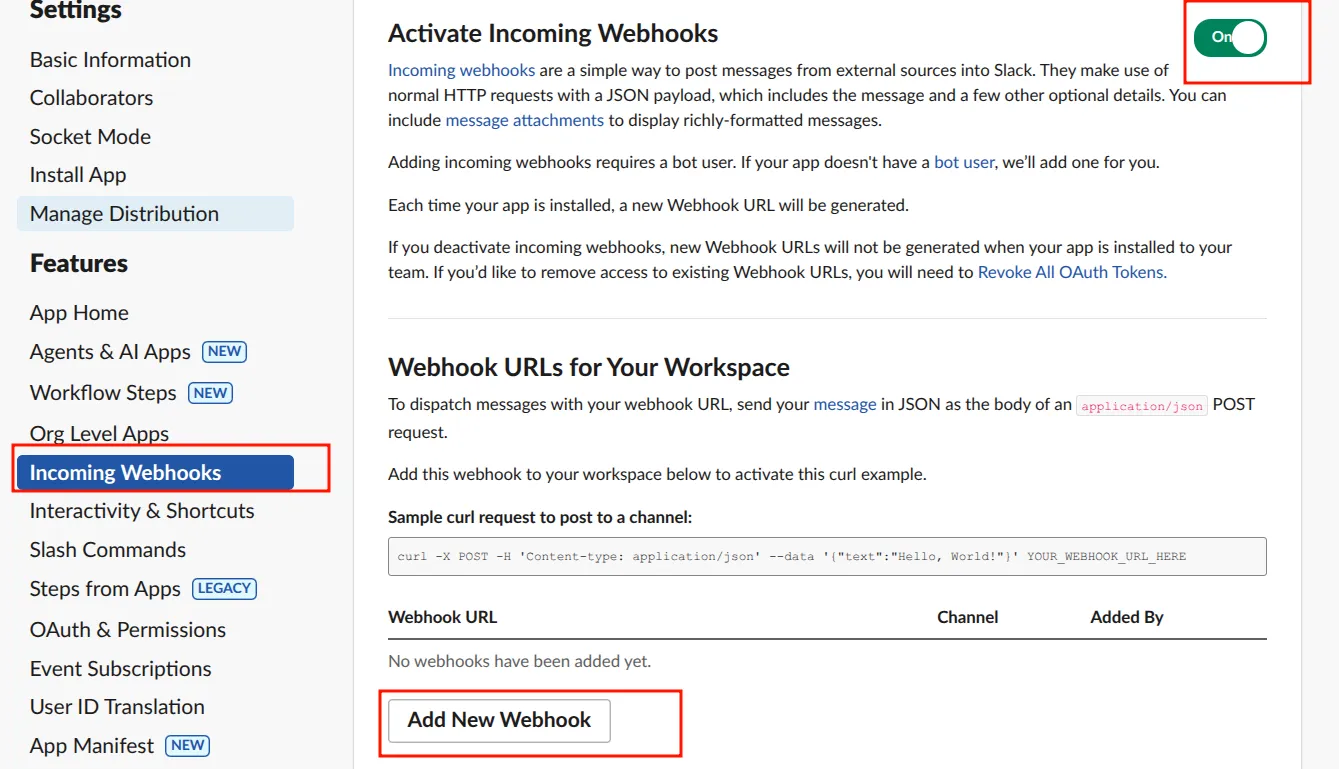
Open Incoming Webhooks, switch it on and click Add New Webhook.
-
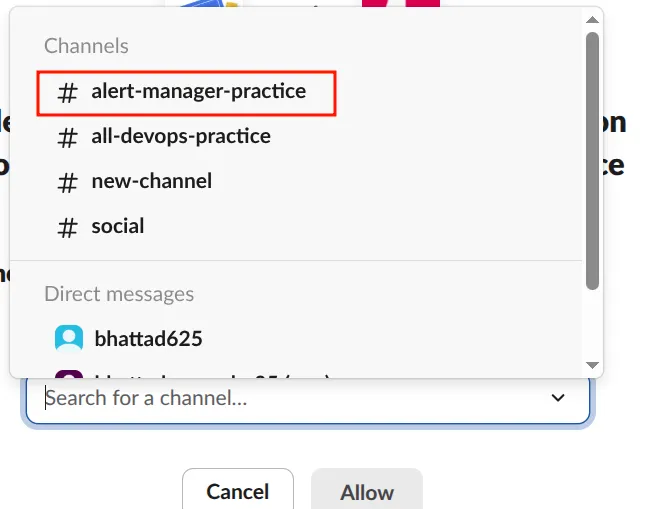
Pick the channel (type its name if it is not listed) and click Allow. Copy the webhook URL that Slack displays.
Add a Slack receiver and a sub-route for the three jobs:
route: # root route
  group_by: ['alertname']
  group_wait: 30s
  group_interval: 5m
  repeat_interval: 1h
  receiver: 'web.hook' # default receiver
  routes:
    - matchers:
        - job =~ "Node_exporter_next_vm|Docker_engine|cAdvisor"
      group_by: ['team', 'env'] # label names, not values
      receiver: slack

receivers:
  - name: 'web.hook'
    webhook_configs:
      - url: 'http://127.0.0.1:5001/'

  - name: slack
    slack_configs:
      - api_url: https://hooks.slack.com/services/XXXXXXXXX/XXXXXXXXX/XXXXXXXXXXXXXXXXXXXXXXXX
        channel: '#alert-manager-practice'
        title: '{{ .GroupLabels.team }} has alerts in env: {{ .GroupLabels.env }}'
text: '{{ range .Alerts }}{{ .Annotations.message }}{{ "\n" }}{{ end }}' # one line per alertThe default file also contains an inhibit_rules block, in which a critical alert mutes matching warning alerts. These rules carry no severity label, so the block has no effect and is omitted.
After an Alertmanager restart, the notifications reach the channel:
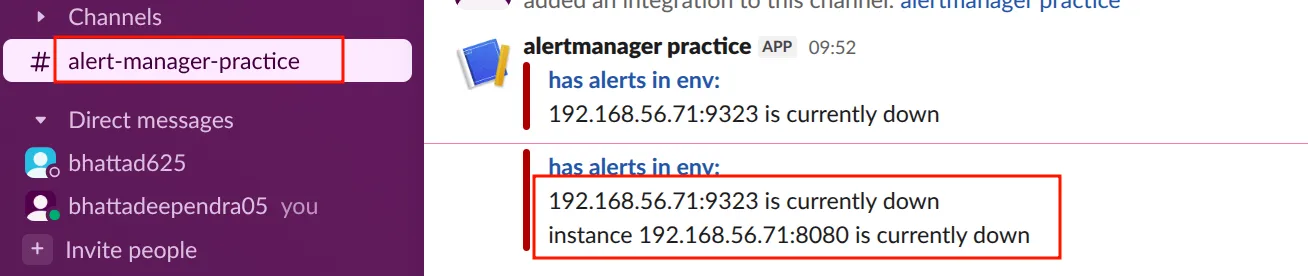
The title reads only "has alerts in env:" with no team or env. The first run used group_by: ['prod', 'dev']. Those are label values, and no label is named prod or dev, so .GroupLabels was empty. group_by requires label names, ['team', 'env'], as in the config above.
Recovery alerts
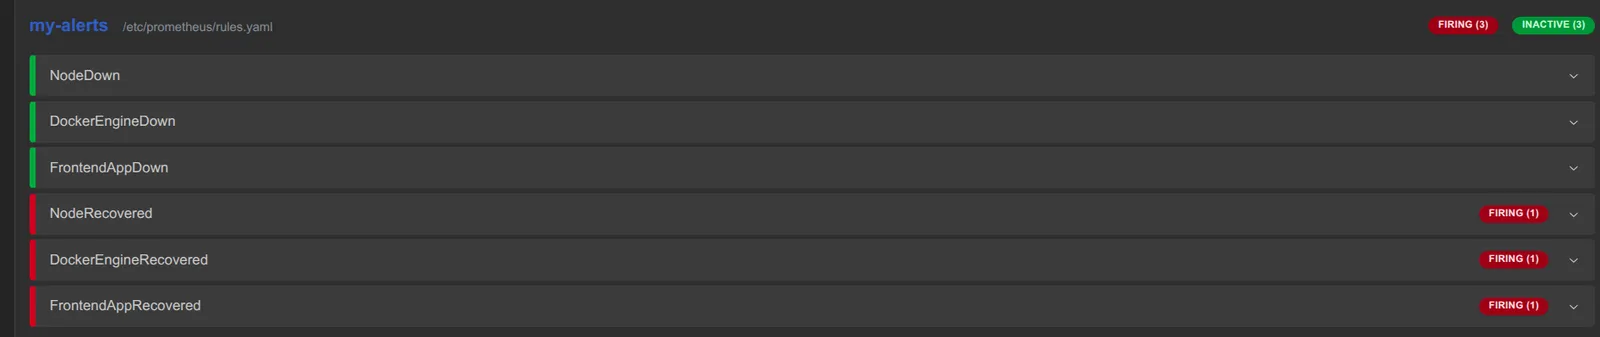
To announce when a target comes back, rename the down alerts to CamelCase and add three recovery rules:
groups:
  - name: my-alerts
    interval: 15s
    rules:
      # DOWN alerts
      - alert: NodeDown
        expr: up{job="Node_exporter_next_vm"} == 0
        for: 2m
        labels:
          team: infra
          env: dev
        annotations:
          message: "🚨 instance {{ $labels.instance }} is currently DOWN"

      - alert: DockerEngineDown
        expr: up{job="Docker_engine"} == 0
        for: 0m
        labels:
          team: microservices
          env: prod
        annotations:
          message: "🚨 Docker engine on {{ $labels.instance }} is currently DOWN"

      - alert: FrontendAppDown
        expr: up{job="cAdvisor"} == 0
        for: 0m
        labels:
          team: Frontend
          env: dev
        annotations:
          message: "🚨 instance {{ $labels.instance }} (frontend) is currently DOWN"

      # RECOVERY alerts: fire only if the target is up now and changed state recently
      - alert: NodeRecovered
        expr: up{job="Node_exporter_next_vm"} == 1 and changes(up{job="Node_exporter_next_vm"}[5m]) > 0
        for: 0m
        labels:
          team: infra
          env: dev
        annotations:
          message: "✅ instance {{ $labels.instance }} has RECOVERED (UP)"

      - alert: DockerEngineRecovered
        expr: up{job="Docker_engine"} == 1 and changes(up{job="Docker_engine"}[5m]) > 0
        for: 0m
        labels:
          team: microservices
          env: prod
        annotations:
          message: "✅ Docker engine on {{ $labels.instance }} has RECOVERED (UP)"

      - alert: FrontendAppRecovered
        expr: up{job="cAdvisor"} == 1 and changes(up{job="cAdvisor"}[5m]) > 0
        for: 0m
        labels:
          team: Frontend
          env: dev
        annotations:
message: "✅ instance {{ $labels.instance }} (frontend) has RECOVERED (UP)"The recovery expression breaks down as follows:
up{job="Docker_engine"} == 1 and changes(up{job="Docker_engine"}[5m]) > 0| Part | Meaning |
|---|---|
up{job="Docker_engine"} == 1 | The target is up right now |
up{job="Docker_engine"}[5m] | Its up/down history for the last 5 minutes (a range vector) |
changes(...) > 0 | The value changed at least once in that window |
and | Both must be true |
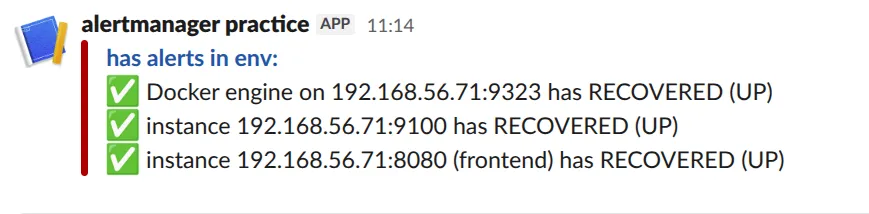
The rule therefore fires only for a recent recovery and goes quiet once the target has been up for 5 minutes. After Docker starts again, all three recovery alerts fire:
Explore metrics in the Prometheus UI
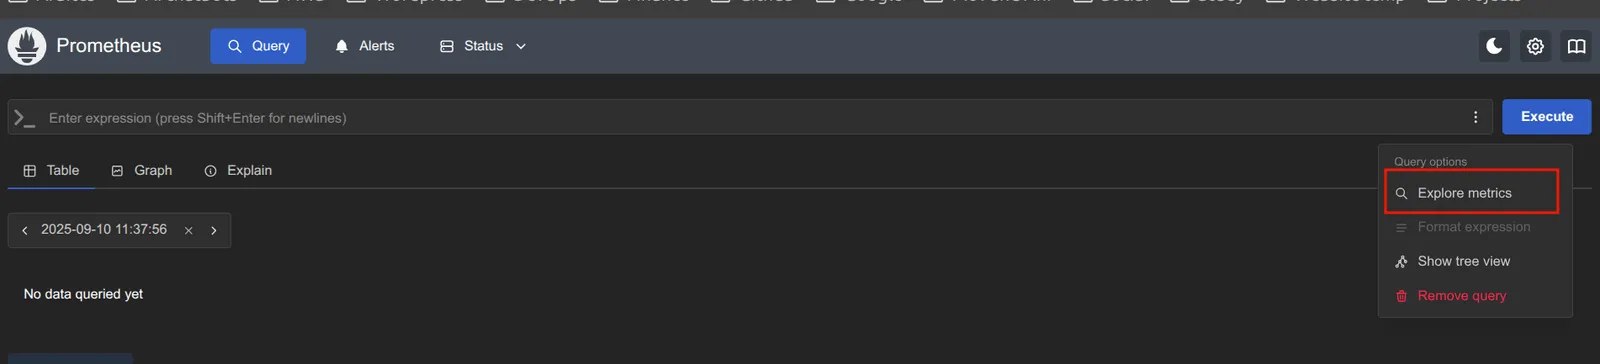
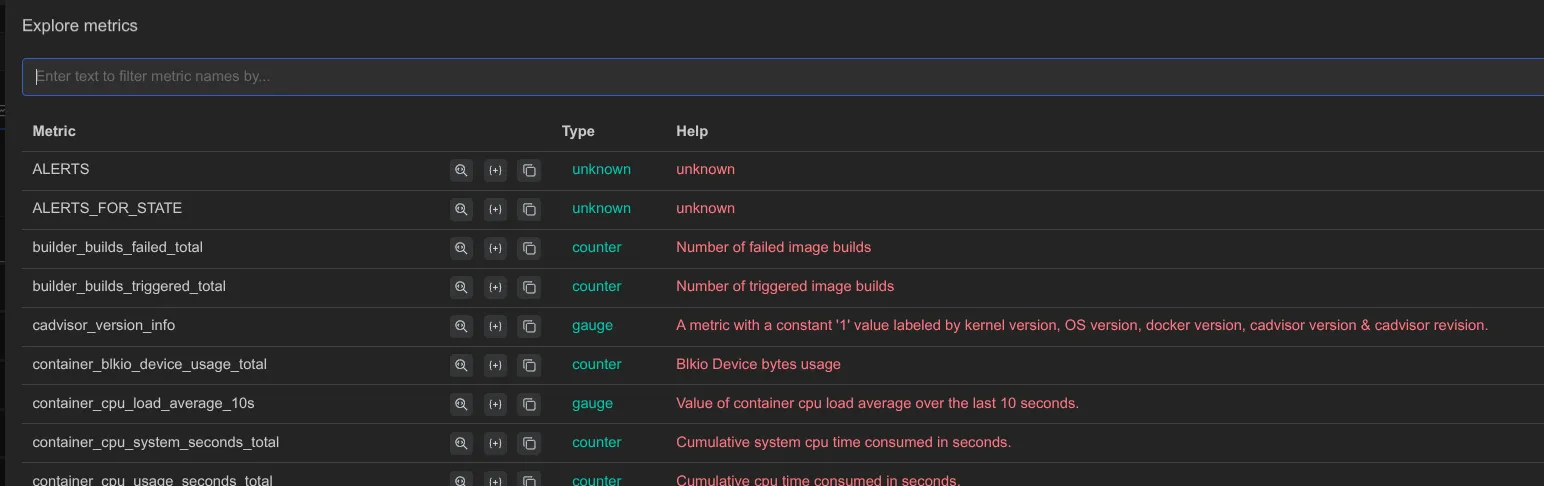
Before Grafana, the Prometheus UI is the quickest way to find metric names. The menu next to the query bar contains Explore metrics:
Any metric can be graphed directly. This query plots container memory from cAdvisor:
container_memory_rss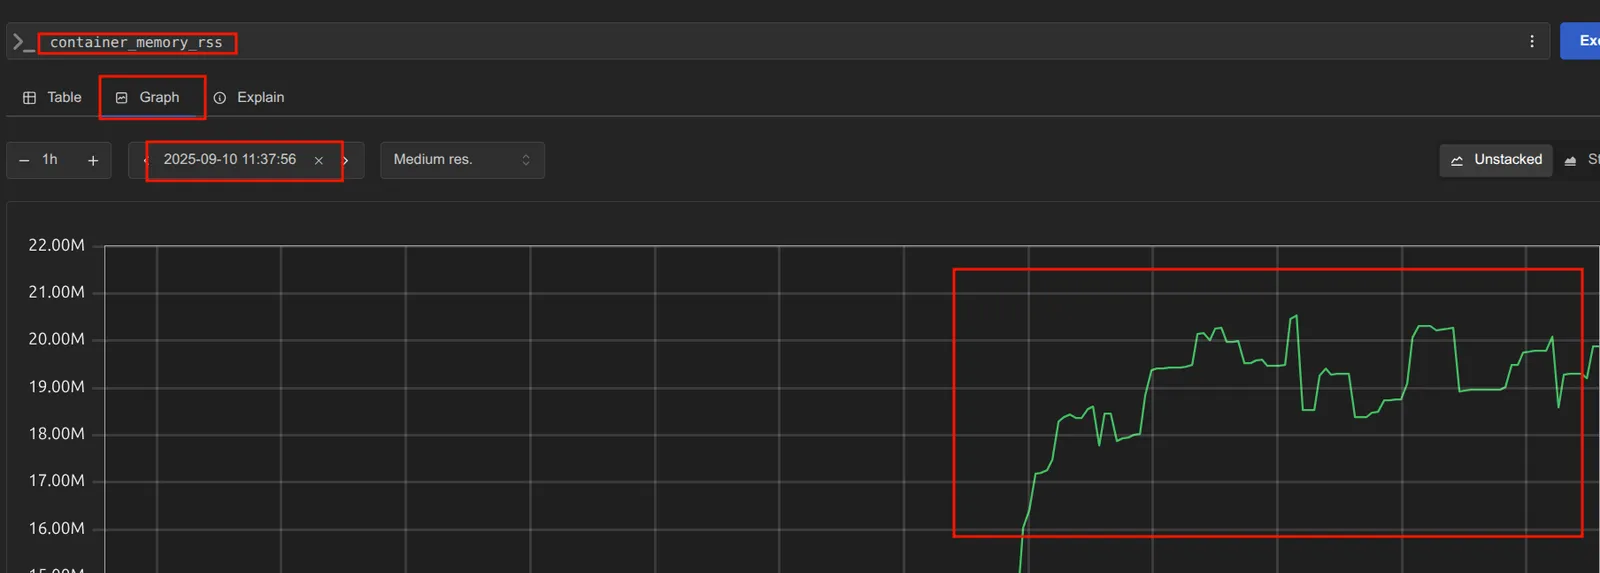
These graphs suit a quick check, not a dashboard; Grafana fills that role.
Install Grafana
Grafana runs as a Docker image, on Kubernetes, or as a package; see Set up Grafana for the options. On Ubuntu, use the APT repository, which also delivers updates, or a .deb from the download page. This lab uses the .deb:
$ sudo apt-get install -y adduser libfontconfig1 musl
$ wget https://dl.grafana.com/grafana-enterprise/release/12.1.1/grafana-enterprise_12.1.1_16903967602_linux_amd64.deb
$ sudo dpkg -i grafana-enterprise_12.1.1_16903967602_linux_amd64.debThe package prints the commands to start it. The service is named grafana-server, not grafana:
$ sudo systemctl daemon-reload
$ sudo systemctl enable grafana-server
$ sudo systemctl start grafana-server
$ sudo systemctl status grafana
Unit grafana.service could not be found.
$ sudo systemctl status grafana-server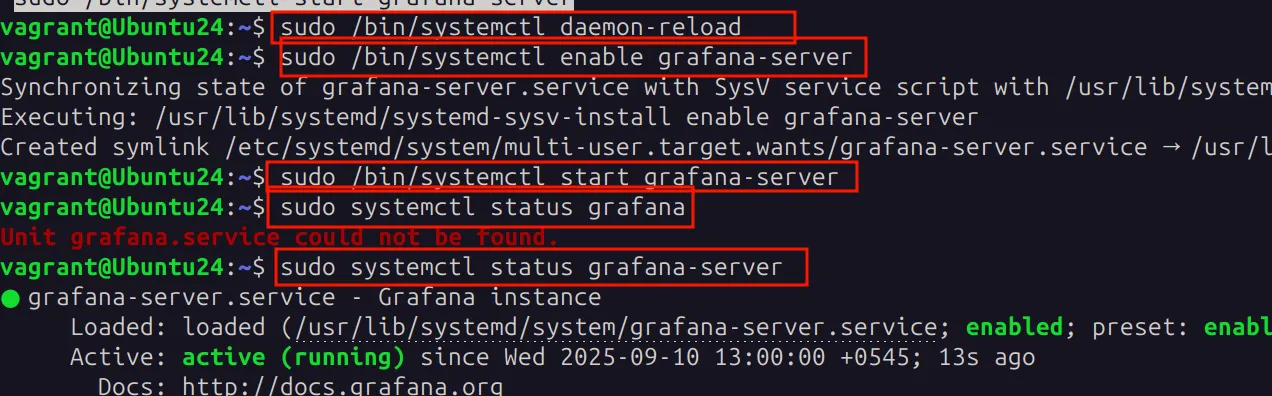
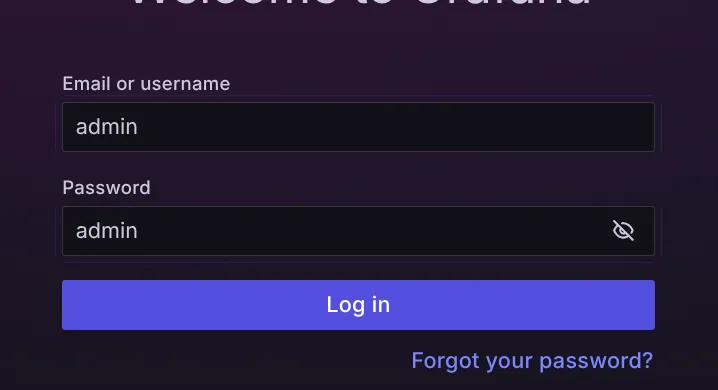
Grafana listens on port 3000. The first login is admin / admin, and Grafana requires a new password immediately (sign-in docs):
Add Prometheus as a data source
In Connections → Data sources, add a Prometheus data source and set the server URL:
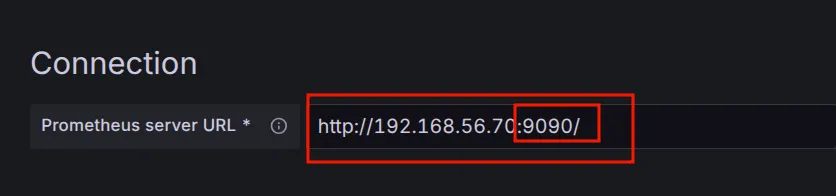
The lab's Prometheus UI has no authentication, so no other fields are required. If your Prometheus uses basic auth or TLS, fill in those fields as well. Click Save & test.
Import a ready-made dashboard
Building panels by hand requires a PromQL query for each one. As a starting point, import a community dashboard from grafana.com/grafana/dashboards. For node_exporter, Node Exporter Full (ID 1860) is the standard choice. Dashboards can be imported by ID, by uploading the JSON, or by pasting the JSON; enter the ID:
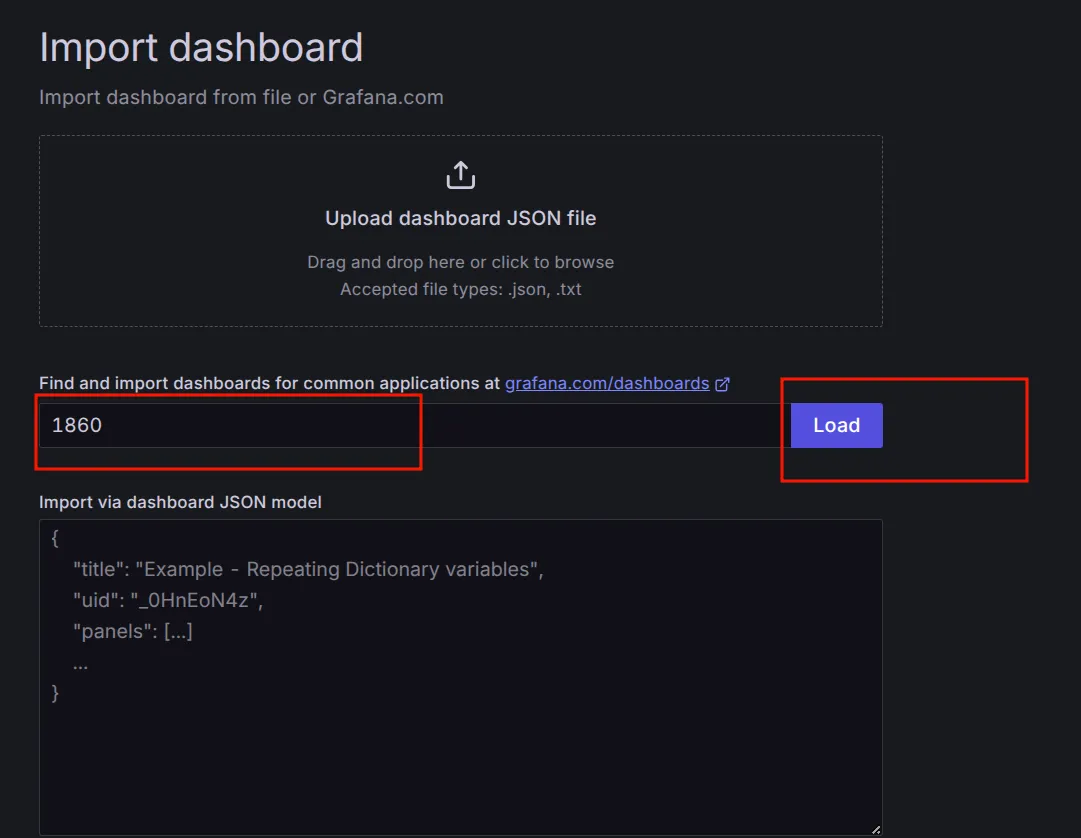
Select the Prometheus data source and click Import:

Grafana can also manage users and its own alert rules.
Troubleshooting
Alerts do not reach Slack
In my lab, the Slack config was correct but no messages arrived. Two places show what Alertmanager is doing:
-
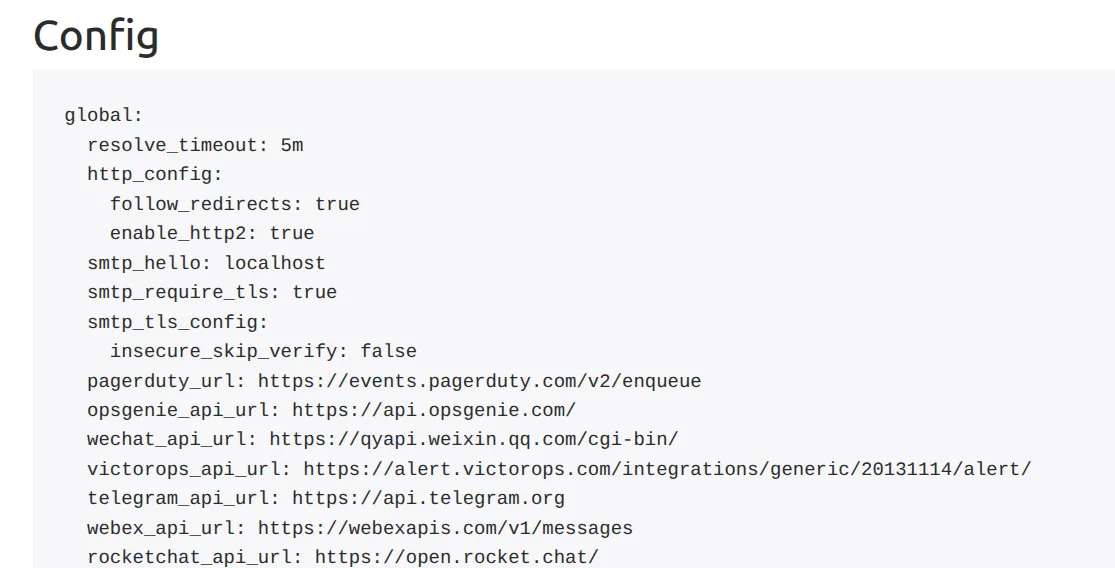
Status page in the Alertmanager UI. It prints the loaded config, which still showed the default config instead of the edited one:
-
systemctl status alertmanager. It shows the--config.filepath in use and the recent log lines: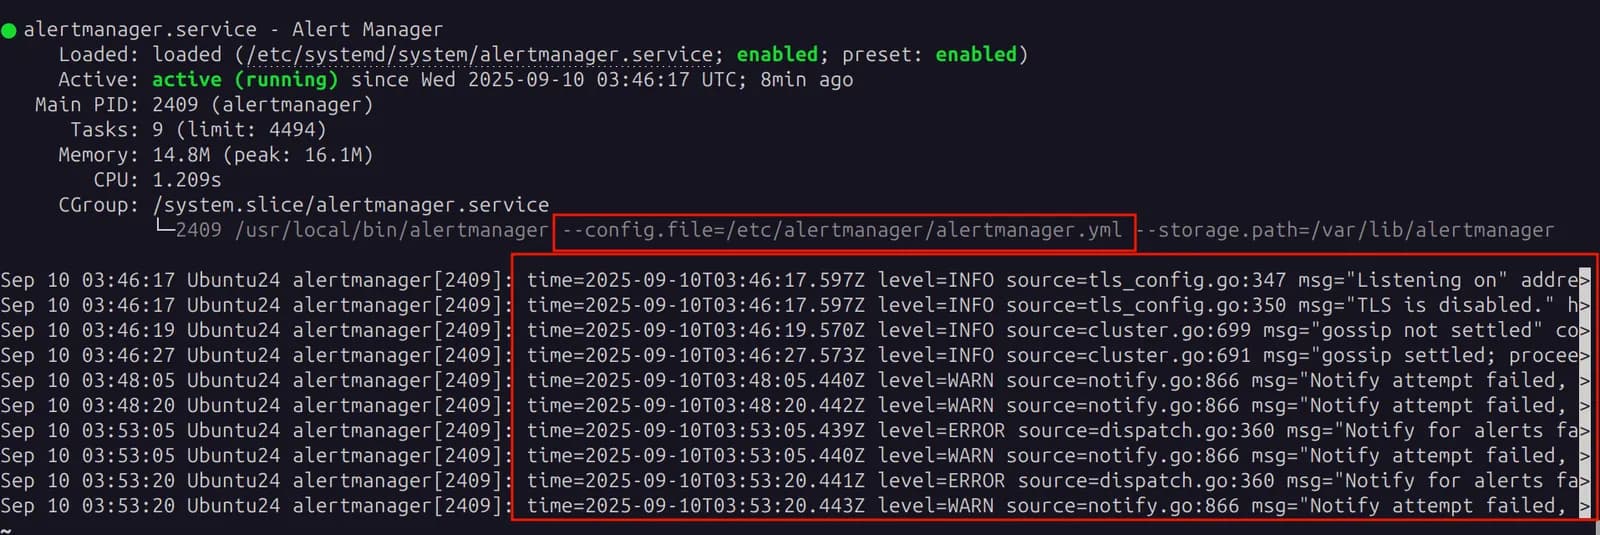
The service reads /etc/alertmanager/alertmanager.yml, but the edits were in a copy under /etc/prometheus. Moving the config to /etc/alertmanager/alertmanager.yml and restarting Alertmanager fixed delivery.
The Notify attempt failed warnings mean Alertmanager could not deliver to a receiver. A likely source is the default web.hook receiver, which posts to http://127.0.0.1:5001/, where nothing listens in this lab. Check each receiver URL, including the Slack webhook.
Other problems
| Symptom | Cause | Fix |
|---|---|---|
| Rules missing from the Alerts page | rules.yaml not next to prometheus.yml, or a typo in the file name (rules.yml vs rules.yaml) | promtool check config reports missing rule files. Fix the path and restart |
| Alert never fires for a target that is down | job in expr does not match job_name exactly | Copy the job name from prometheus.yml or the Target health page |
| Alertmanager does not start after an edit | Route points at an undefined receiver, or a YAML error | amtool check-config /etc/alertmanager/alertmanager.yml |
| Slack title shows empty values | group_by lists label values (prod, dev) | Use label names: group_by: ['team', 'env'] |
Docker comes back after systemctl stop docker | docker.socket restarts it on demand | Also run sudo systemctl stop docker.socket |
Unit grafana.service could not be found | The service is named differently | sudo systemctl status grafana-server |
Key takeaways
- Prometheus decides when an alert fires; Alertmanager decides who hears about it and how.
- Use
for:to avoid alerts on a single failed scrape, and matchjoblabels exactly toprometheus.yml. - Check the config Alertmanager loaded (Status page,
--config.fileinsystemctl status) before debugging anything else. group_bytakes label names. Usematchersinstead of the deprecatedmatch_re, andcontinue: trueto notify several receivers.- Treat a Slack webhook URL as a secret;
api_url_filekeeps it out of the config. - Grafana with a community dashboard such as ID 1860 provides a complete node_exporter view without writing PromQL by hand.
This is the final part of the series. Start from the beginning with Prometheus Setup: node_exporter, TLS, Docker and Relabeling.
Keep reading
- Prometheus Setup: node_exporter, TLS, Docker and Relabeling
Install Prometheus and node_exporter as systemd services, scrape a second VM over TLS with basic auth, monitor Docker with cAdvisor, and apply relabeling and the Pushgateway.
- Running Tomcat as a systemd Service
Write a systemd unit that runs Apache Tomcat as a dedicated non-root user, starts it at boot, restarts it after a crash, and is managed with systemctl.
- Essential Linux Commands for DevOps
A task-based Linux command reference: navigating and managing files, reading logs, grep, sed, cut and awk, redirection, Vim, services, and basic networking.